Tuesday, April 2, 2019

The Warming of Alaska

Many of us here in the lower 48 states are still dealing with the last whimpers of winter. In the past 24 hours measurable snow fell in the Rockies and northern Plains, across northwestern Iowa, and in the Great Lakes, and even in the southeast where snow was falling Tuesday in parts of North Carolina. In Alaska, however, the last few days have been spectacularly warm by Alaska standards. It was news that saw wide distribution in social media, but not much in terms of a "national" new story. How bad can it be when you high temperature in March is in the mid 30's, 30°F to 40°F above normal? Well, that would be like maximum temperatures here in the central Midwest being in the upper 80s to mid 90s, while records are generally in the low 80s this time of year.

Maximum temperature for March 30 in the northern half of Alaska (left) and the departure from normal (right). Credit:UAF/ACCAP/Rick Thoman, @AlaskaWx

A strong upper level high centered over the state was responsible for the record warmth.

The 500 mb chart for the morning of March 30 (left), the the departure from normal (right) with Alaska circled.

However, while the record warm daily temperatures the past week were newsworthy, the abnormally warm weather has been a persistent feature of the Alaskan climate for the past several years.

The chart below shows that monthly average temperatures have ranked in the top 50 percent in all but 10 months. More remarkably, monthly temperatures have ranked at the 90th percentile or higher 28 out of the 74 months.


Here are plots of the daily average temperatures for four Alaskan cities since January. Temperatures in Juneau are pretty well distributed between above and below normal. However, look at the chart for Barrow. Days below normal since the first of the year have been few and far between.

Plots of the departure from normal of the daily average temperature (°F) for four Alaskan cities since January 1.
Credit: Alaska Climate Research Center


A more detailed look at Barrow's daily temperatures shows how striking the warmth has been since September 1. The maximum temperature has been below normal on only three days since September 1. For the past eight days both the maximum and minimum temperatures have been higher than the normal maximum temperature.

Credit: Alaska Climate Research Center
The Juneau International Airport has set or tied a record high temperature each of the last eight days. Records go back to 1936 in Juneau. The low temperature in Fairbanks on both Monday and Tuesday was 34°F. The city’s lowest temperature has only been above 34°F in March on one other day in the last 114 years. In both Anchorage and Juneau there was no measurable snow during the entire month of March.

March 2019 was the warmest on record across most of the area north of the Alaska Range and on the west coast north of Bristol Bay. This follows a January that was the 26th warmest and February that was the ninth warmest on record.


Credit: Alaska Climate Research Center


Some locations recorded their earliest 70°F temperatures on record. Klawock, in southeastern Alaska, reached 70°F on March 19, the earliest any location in the state has reached 70°F.


The persistent warmth in Alaska is having serious consequences for a state the has adapted to living with extreme cold. Thawing of the permafrost is affecting the stability of the land that supports homes and roads. The softening land surface causes shifting foundations, cracked walls, and in some cases collapse of structures. Whole communities may need to be relocated. Roads crack and sink as the land supporting them shifts. Portions of the Iditarod race had to be shifted because of thin or no sea ice, or thin ice on rivers and streams normally used for travel. The breakup of ice on Alaska's rivers, a significant event marking the transition from winter to spring, is occurring earlier than normal, Ice breakup along with snowmelt can cause serious flooding. The extent and thickness of sea ice has been declining especially in the past 10 years. At the end of this March ice in the Bering Sea was at a record low extent.

Credit: Zachary Labe @Zlabe


Tuesday, March 19, 2019

Inundation - Disaster in Nebraska

The last three days have been some of the "quietest" days, precipitation-wise, on the CoCoRaHS maps in almost two years. It's tragically ironic that on such quiet days a slow, widespread disaster is on-going from the central Plains to the Midwest.

Last week's huge and intense winter storm got a lot of attention due to the extremely high and in some cases record wind speeds measured, record low pressure, and widespread blizzard conditions. While that was big news at the time, the aftermath of this storm turned out to be more insidious and damaging than anything that occurred while the intense low pressure system was spinning over the U.S.

On the warm side of the storm, extending from Texas through the central Plains, warm most air was pulled northward by the strong circulation around the system. Temperatures in the 60s surged through Kansas and into southern Nebraska.


While the air was mild, there was still a lot of snow on the ground, and the soil underneath it was generally frozen.

Snow depth on March 11, 2019.
Credit: NOAA NOHRSC


4-inc soil temperatures under sod for the 24-hour period ending 3/13/2019.
Credit: MRCC Regional Mesonet Program
Rain fell on the warm side of the storm, with anywhere from one to three inches across Nebraska and southern South Dakota in a two-day period.


The mild air and heavy rain resulted in rapid snow melt. With the ground frozen, the water had no where to go except into rivers and streams. The snow across Nebraska held a water equivalent from one to more than two inches, so any runoff from the rain would have that much additional water from the melting snow.

Snow Water Equivalent (SWE) on March 11, 2019.
Credit: NOAA NOHRSC
The melting was rapid and considerable as the storm lifted to the northeast.

These maps show the snow melt for the 24-hour periods ending the mornings of March 13 and March 14. Snow melt was 2 inches per day or more.

By Friday, March 16 snow had disappeared from most of eastern Nebraska and western Iowa, draining into the rivers and streams.


The sudden surge of water running off from the precipitation and melting snow along with ice on the rivers began to compound the disaster. Water flowed from smaller streams into rivers and many then into the Missouri River. While the Missouri River has been getting attention, a number of smaller rivers in Nebraska reached major flood stage.


The Missouri River went from normal to record flood stage at Nebraska City and Plattsmouth in just 48 hours.

Hydrographs for the Missouri River at Omaha, Plattsmouth, and Nebraska City.
In addition to the flooding, huge chunks of ice that recently covered the rivers caused damage to bridges, roads, and fields. Whole towns have been cut off because of flooded or washed out roads. Farmers and ranchers are suffering devastating losses as fields are flooded and damaged by water and ice. Ranchers are having a difficult time feeding or even reaching their livestock, and many lost livestock to either the blizzard conditions or the flooding. An early estimate is that this disaster could result in a $400 million loss to the Nebraska livestock sector.

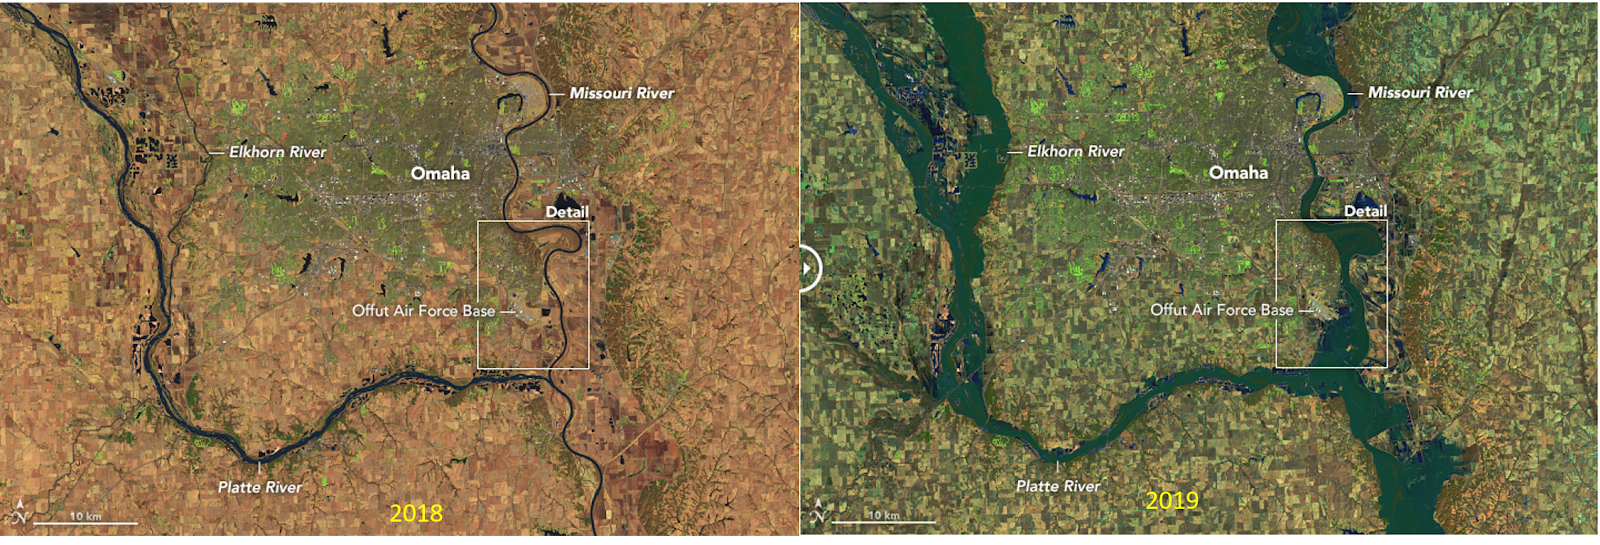
A comparison of eastern Nebraska in 2018 with no flooding (left) with 2019 (right).
Credit: NASA Earth Observatory
The National Weather Service Office in Valley, NE, west of Omaha and between the Platte and Elkhorn rivers had to be evacuated on Friday due to encroaching floodwaters from the rivers Operations were moved to Hastings, NE and forecasters will continue to work from there until floodwater recede and equipment can be checked and made operational. Almost 30 percent of Offutt Air Force Base near Omaha is flooded by the Missouri River. At it's closest extent the Air Force base is a little more than a mile from the river at normal stage.

Close-up view of the Omaha, NE area, 2018 and 2019.
Credit: NASA Earth Observatory
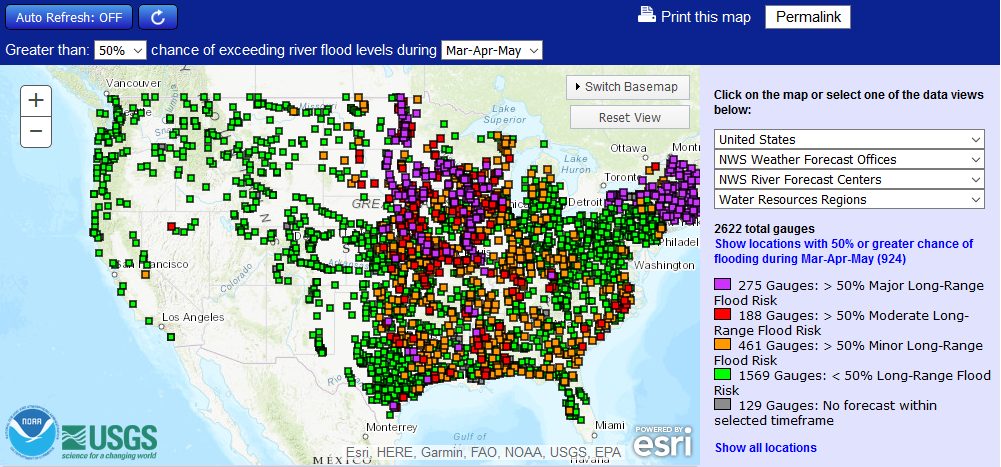
Even though river levels are slowly subsiding in Nebraska, recovery will be long and arduous. The northern Plains and central Midwest are continuing to deal with flooding conditions and it looks like flooding could be a big concern this spring in a large part of the country, particularly the central U.S. and the Northeast. This map shows where there is a greater than 50 percent chance of a flood risk from March through May.


The National Weather Service will be updating its Spring 2019 flood outlook on March 21. You can be sure there will be a lot of people closely paying attention.

Monday, March 11, 2019

Overview of February 2019 and Winter 2018-2019

How "bad" was the winter of 2018-2019? To be sure, winter is not yet over for some parts of the country no matter what the calendar says. As usual, though, how bad the winter was really depends on where you live.

February, the last month of climatological winter, was a cold one for the northwest half of the country, and very warm in the southeastern U.S. Montana experienced it's second coldest February on record as did North Dakota. Florida experienced its second warmest February on record.

February 2019 average temperature, departure from normal, and state ranking.

The cold across the northern tier was especially persistent. Great Falls, MT recorded nine days when the temperature didn’t rise above zero, and there were 23 nights when it dropped to zero or below. The longest stretch of subzero readings was 13 days, from February 3-15.The only days above freezing were February 1 and 2, when the high was 55°F and 49°F, respectively. The average February temperature in Great Falls was an astounding 27.5°F below normal!


The brutally cold weather continued into the first week of March, with a number of Montana locations setting all-time low temperature records for the month. Great Falls finally rose above freezing on March 7th for the first time in 32 days when the temperature reached a relatively balmy 36°F.

This was the second wettest February on record for the lower 48 states. Precipitation was much above normal in the much of the western U.S. west of the Rockies, the upper Midwest, and the Ohio and Tennessee Valleys. In the west, the only exception to the wet weather was an area from northwestern Oregon through much of Washington state. Tennessee recorded its wettest February on record. Many Tennessee CoCoRaHS observers reported double-digit precipitation totals during the month, with the highest 18.49 inches reported by the observer at Bells 2.5 NE in Crockett County (TN-CK-4).

February 2019 accumulated precipitation, percent of normal, and state rankings.
Speaking of being wet, the U.S. did record its wettest climatological winter in 125 years. It was also the wettest December-February in Tennessee. In terms of actual precipitation during the winter, the highest amounts were in California where a number of locations measured more than 50 inches. The California CoCoRaHS observer in Honeydew 3.2 SSE (Humboldt County, CA-HM-70) measured a whopping 89.84 inches, with more than half of that amount (45.14 inches) falling in February. 

Accumulated precipitation, percent of normal, and state ranks for December 2018-February 2019.

Winter temperatures were near to below normal across the northwestern half of the lower 48 states, and near to above normal across the southeastern half. The very cold weather in the northern Rockies and Plains in February was tempered by a warmer than normal December and January. The central and southern Plains and Midwest did endure several Arctic outbreaks, but they were generally short-lived.

Average temperature, departure from normal, and state ranks for the period December 2018-February 2019.

The snow season is far from over for many portions of the western U.S. (there is a reason the snow season runs from July 1 to June 30). As of the end of February, most of the U.S. had seen snow. Snow has been above normal from the central Plains through much of the northern Midwest, a small portion of the central Appalachians, and far northern New England. The Cascades and the Sierra Nevada were the big "winners", piling on the snow particularly in February. Some locations in northern California received more than 25 feet of snow in February alone.


At the end of February much of the southern half of the U.S. was without snow cover. Snow was still deep over the western mountains, the upper Great Lakes, and northern New England.


Additional details on the 2018-2019 snow season will be the subject of a future post.

Tuesday, January 29, 2019

Baby, It's Cold Outside!

I don't know about you but I have pretty much had my fill of the "polar vortex" stuff. Yes, it's real, and meteorologists have known about it for a long time. It seemed to come into popular vogue during the winter of 2013-2014, when a rather sudden onset of cold and snow in late January hammered the eastern U.S. for the next six weeks. Many locations in the northeast experienced the most severe winter on record.

The fact is that these frigid Arctic outbreaks have occurred in many winters, and they were related to changes in the polar vortex. The cold air now overspreading the central and eastern U.S. this week is one of the more stronger cold air outbreaks in recent memory. How bad it is is often a matter of your experience and perspective. I was living in central Illinois during the late 1970s and early 1980s when the state experienced four of its most severe winters on record. I went back and looked at a few of the cold air outbreaks in the past. One thing I soon realized was that many people under the age of 25 or 30 haven't experienced this kind of severe cold.

This graphic from NOAA depicts how the polar vortex affects our weather in the U.S.


Data I looked at was the frequency of low temperatures below zero in Chicago by 10 year periods going back to 1959. I picked Chicago since it seems to be the high population "ground zero"  for this Arctic outbreak (no pun intended). I also looked a runs of days of low temperatures at different thresholds.

As of today, Chicago has experienced only 15 days with low temperatures less than -20°F since 1872. The all-time record low is -27°F on January 20, 1985. There have been 71 days in the record with a maximum temperature 0°F or below. Only six of those have occurred in the past 30 years, the most recent prior to this year on January 6, 2014.


If we look at runs of days with minimums of -10°F, the longest is seven days from January 14-20, 1995. The longest run of days of -15°F or lower in Chicago is four, December 22-25, 1983. In general persistent, severe cold is not that common in Chicago in the past 20 to 25 years.

This chart shows the frequency of different thresholds of low temperatures in Chicago for ten years periods starting with 2018 and back to 1959.


Frequency of minimum temperature below 0°F for different thresholds for Chicago, IL

What this shows is that the frequency of temperatures below zero is 42 percent less in the past 30 years, compared to the 30 years prior. The frequency of low temperatures -10°F or lower is 61 percent less for the same periods.

So, those under 35 years of age in the Midwest likely have experienced far fewer days with the extreme cold that is knifing through the U.S. this week. Record lows temperatures will be set, and no doubt a few all-time record lows will topple as well. The frigid air combined with the strong, gusty winds driving this cold south will produce dangerous wind chill readings that few have experienced. This cold will affect a significant portion of the eastern U.S. population. This map from Ryan Maue of Weather.US shows the extent of the cold through the next five days, and the percentage of the lower 48 states experiencing the cold. He estimates almost 91 million people will experience temperatures 0°F or lower, and 25 million will experience temperatures -20°F or colder.


Finally, this plot shows the trajectory the air is taking into the U.S. from its source in the Arctic.


Stay warm, everyone!

Thursday, October 25, 2018

More Rain for Texas

Location of Hill Country in Texas
Last week persistent torrential rain fell over the Texas Hill Country north and northwest of San Antonio/Austin causing record and near-record flooding on rivers and lakes in the area. This area is particularly susceptible to flash flooding and is known as Flash Flood Alley. It wasn't just the amount of rain, but the rainfall rates that helped cause the problems this week, as well as a record wet September.

The heaviest rain fell between October 14 and October 16, with lighter rain the remainder of the week. In those three days more than a foot of rain fell in the Hill Country, with 7 to 10 inches of the rain falling in the 24-hours ending at 7:00 a.m. on October 16. The CoCoRaHS stations shown below in Llano and Mason Counties tallied the highest totals during the three-day period and for the week.


The persistent rain last week over Hill Country and central Texas was caused by what is called an "overrunning" pattern. In this case a cold front, marking the leading edge of a large cold air mass that spread across the western two-thirds of the U.S., lie along the Texas coast. Warm, moisture-laden air from the Gulf rode up and over the dense, cold air in the lower layers of the atmosphere producing clouds and rain. In addition, several waves of low pressure moved along this frontal boundary enhancing the upward motion and the flow of air from the Gulf.


Surface weather map for Monday, October 15 at 10:00 a.m. CDT.

Here is the upper air sounding from Corpus Christi, TX the evening of October 15. You can see the cold layer of air near the surface and northerly winds, and the southerly winds aloft along with the warmer, saturated air. During the winter an overrunning setup like this could produce significant freezing rain.


Atmospheric sounding plot (Skew-T) for Corpus Christie, TX at 7:00 p.m. CDT October 15. The solid red line is the temperature plot, the solid green line is the dew point.

A wet September and rain earlier in October meant that any rain last week was going to run off into the rivers and streams. The rise on rivers in the Hill Country was spectacular, rising 10 feet or more in just a few hours. These tributaries eventually feed into the Colorado River (the Texas Colorado River, not the Colorado River). The Colorado River flows southeast through a series of lakes  used for flood control and recreation (Buchanan, Inks, LBJ, Marble Falls, Travis, and Austin) and eventually to the Gulf of Mexico.

Watershed of the Texas Colorado River.
Many of the tributaries to the Colorado River quickly flooded, with all of the water feeding into the Colorado River. The Llano River at Llano came close to setting a new record flood level but fell just short of the record of 41.5 feet set on June 14, 1935. Flood stage is 10 feet. The flooding washed out a highway bridge over the Llano River outside Kingsland, TX on Tuesday, October 16. Here is video of the bridge washing out. Damage to homes and other infrastructure was extensive.

Hydrographs for rivers in Hill Country during the flooding, compiled by NWS San Antonio/Austin.

Lakes Buchanan, Inks, LBJ, Marble Falls and Travis were closed to recreational use last week and were expected to remain closed until at least until today. On Monday, a boil order was issued by Austin Water for all of its more than one million customers due to elevated levels of silt from the flooding. The boil order is expected to be in effect until at least Sunday.


This week the remnants of Hurricane Willa, which made landfall on the west coast of Mexico on Tuesday, interacted with an upper level trough moving through central Texas triggering additional rain yesterday. The heaviest amounts fell between Galveston and Houston where 2 to more than 5 inches fell. Much of the Dallas/Fort Worth metroplex received 1 to 3 inches of rain. Most reservoirs in central Texas are now near or over capacity.

Texas reservoir status as of October 25, 2018.
Source: Texas Water Development Board

Rain is still needed in west Texas and in the panhandle, but much of the state could use a break for a while. Precipitation is much above normal since September 1, more than 20 inches above normal in some places.


Tuesday, October 9, 2018

So Much Weather...


Trying to decide what to write about is a difficult task this week because there is so much to talk about - summer-like heat in the east, hurricanes, snow in the Rockies and Plains, and heavy rain from Texas to Iowa. A number of , so Here is a quick summary of the significant weather events taking place across the U.S.

To start with, here is the latest watch/warning map for the U.S.to give you an idea of the variety of weather ongoing.


Watch /Warning/Advisory map as of 9:23 p.m. CDT 10/9/2018. The latest map can be found at www.weather.gov

Tropical Weather


The major news this week is Hurricane Michael, destined to make landfall along the coast of the Florida Panhandle on Wednesday. Dangerous winds gusting more than 100 mph and catastrophic storm surge are expected as Michael approaches and crosses the Florida coast. As I write this Michael is a strong Category 3 storm and is expected to reach Category 4 before landfall. 


Hurricane Michael as the sun was setting over the eastern Gulf of Mexico at 6:07 p.m. EDT.
Image from https://weather.cod.edu/


Infrared image of Hurricane Michael at 10:07 p.m. EDT. Image from https://weather.cod.edu/


Hurricane Leslie has been looping around the Atlantic for 17 days, and reached hurricane again tonight. I it expected to maintain tropical status as it moves east toward Africa this week.

This afternoon, Tropical Storm Nadine in the eastern Atlantic was named and is forecast to move northeast before weakening by Friday.

For the latest information on Hurricane Michael visit the National Hurricane Center web site.


Winter Weather

Snow has been falling on and off in the Rockies the past several days as cold air spilled into the region and a low spun up over the southern Rockies. Snowfall from Monday to Tuesday accumulated from Montana south through Colorado, and from Colorado northeast through the Nebraska panhandle and into the Dakotas. More than 5 inches of snow fell west of Denver in the 24 hour period ending Tuesday morning, and 6 to 8 inches accumulated northeast of Rapid City, SD. Tonight winter weather advisories extend from northern Minnesota south into western Kansas.


24 hour snowfall ending the morning of October 9, 2018.

Heavy Rain

It has been a stormy set up on the boundary of the cold air in the west and warm air in the east, and rain fell this week from Texas northeast to the Canadian border. Rainfall accumulations this week ranged from 7 to 9 inches in parts of Texas, 6 to 8 inches in western Oklahoma, and 7 to 10 inches in eastern Kansas and in the Kansas City metro area.


Big changes are ahead later this week. Hurricane Michael will make landfall, weaken, and move into the Atlantic. Cold air that has been pooling in Canada and the western U.S. will spread to the east and Gulf coasts bringing an end to summer-like weather for most.

Monday, October 1, 2018

CoCoRaHS Observers in Right Place, Right Time in Western NC

When I pull up the CoCoRaHS web site each day one of the first things I check is the national map for any unusually high values that might indicate an error.  On Sunday September 30 the first thing I noticed was that the scale showed a top value over eight inches. There was a red dot over western North Carolina. "Perhaps an observer entered observation time as precip or made a typo entering the amount", I thought. It's a very common error.


Zooming in, it was clear this was no error. The southeast corner of Buncombe County, North Carolina got a very large amount of rain, and heavy rain also fell in surrounding counties.


Rainfall amounts of 1 inch or more from Sunday morning, September 30.
The largest amount of 8.11 inches was recorded by the observer at NC-BC-115, Black Mountain 5.5 SE. The comments entered by the observer helped tell the story of what happened overnight. Comments are very helpful and important in events like this.


What was really interesting was that this was an isolated storm for the most part. Out of 33 CoCoRaHS observers reporting in Buncombe County that morning, 22 reported amounts of 0.10 inch or less, and about half of those reporting zero.


Radar showed a nearly station storm over southeastern Buncombe, western McDowell, and western Rutherford counties. The center of the white circle is the approximate location of NC-BC-115. The first image in the sequence shows two strong cells just to the south. The middle image is three hours later and the heavy rain has been falling for two hours.

Radar images from weather.us

The precipitation accumulation map from the NWS Advanced Hydrologic Prediction Service (AHPS)  indicates 6 to 8 inches over southeast Buncombe County, and just how small the area of heavy rain was.


The heavy rain resulted in flash flooding with debris flows, roads and bridges washed out in the affected counties. The National Weather Service issued an Areal Flood Watch at 4:46 a.m. EDT.


It is possible that that more than 8.11" of rain fell in the area near NC-BC-115, but were it not for that observation and that of the observer at NC-RT-6 Chimney Rock 0.3 with 5.01" there would not have been ground truth for this event. Right place, right time.