Monday, September 30, 2013

Colorado Floodwaters Roll On

In an earlier post I described how the runoff from the heavy rain that caused the devastating flooding in Colorado was moving down the Platte River causing dramatic rises in water levels in eastern Colorado and western Nebraska.  Several locations along the Platte River are near still near or above flood stage in central Nebraska, but water levels are falling and should continue to do so.

River gauge status in lower Missouri River basin as of 8:15 p.m. CDT September 30.

Hydrograph for the Platte River near Grand Island, NE as of 8:15 p.m. CDT September 30

The "flood pulse" continues to move downstream and is starting to enter the Missouri River.   Here are the hydrographs for the Missouri River at Nebraska City, NE and for the Missouri River St. Joseph, MO.  The predicted rises in river level are modest and nowhere near flood stage. It may difficult to track the floodwaters beyond central Missouri as the wide extent of the Missouri and the interaction of other tributaries dampen the effects of the additional water.


If you are interested in following the analysis of the Colorado flooding and its aftermath, the Colorado Climate Center has put together a special web site on the flood. It includes a timeline of events, the meteorology behind the heavy rain and subsequent flooding, and climatological perspective. As updated information and analyses become available they will be posted on this site. Here is the link:

Colorado Flood 2013 web site

Thursday, September 26, 2013

Stormy Days Ahead for Pacific Northwest

The month of September has been wetter than normal so far in most of Washington, Oregon, and Idaho after a dry summer. Drought has been absent from all but a small portion of Washington but still encompasses most of Oregon and Idaho as well as the remainder of the western states except for the eastern two-thirds of Montana.


It looks like it will get a lot wetter the next 3 to 5 days. A series of strong storm systems will slam into the Pacific Northwest producing copious amounts of rain. The first and strongest of these storms will arrive this weekend, and up to six inches of rain could fall from the Cascades to the coast.

Northern Pacific 500 millibar forecast map for Sunday, September 29 at 5:00 p.m. PDT

Quantitative precipitation forecast for the three days ending 5:00 p.m. PDT Sunday, September 29


Higher amounts could accumulate over west facing slopes of the Cascades where the moisture-laden onshore flow will be forced upward by the terrain. The first half of next week will be cloudy and showery as the large upper level trough remains over the region and smaller disturbances rotate through it.  A second system may bring more significant rain about midweek, though this system should be weaker.


The 5-day quantitative precipitation forecast for the period ending 5:00 p.m. MDT Tuesday, October 1.


Saturday, September 21, 2013

The Long Island Express - The Great New England Hurricane of 1938

Saltaire, Long Island.
Source: Frank Markus, saltaire.com
We are three-quarters through the peak month of hurricane season and so far the tropics have beenfairly quiet.  Seventy-five years ago today, however, a destructive hurricane slammed into Long Island and southern New England, causing 700 deaths and $620 million in damage (1938 dollars equivalent to $41 billion in 2010).

The Great New England Hurricane of 1938, also dubbed the Long Island Express because of its high forward speed, originated off the Cape Verde Islands on September 9. It traveled across the Atlantic the next 11 days, becoming a hurricane on September 16. It turned north about 400 miles east of Jacksonville, FL on September 20, It would stay on that due north track, along the 72.5° meridian, until it reached southern Vermont on September 21. The northerly storm track was forced by a cold front that moved off the east coast on September 20.

Surface map on September 20, 1938. Blue line signifies the approximate position of the cold front
Estimated track of the hurricane on September 21, 1938, with hourly positions in local standard time and central pressure in millibars. Source:  Jarvinen, B. R., 2006: Storm Tides in 12 Twelve Tropical Cyclones (including Four Intense New England Hurricanes

Surface map for 2:00 p.m. September 21, 1938. The hurricane made landfall sometime between 2:15 and 2:45 p.m.
 
Source: Geological Impact of the 1938 Hurricane
One of the remarkable aspects to this storm was its forward speed. At landfall this Category 3 hurricane was moving at a forward speed of 47 mph. Sustained winds were 109 mph at Fishers Island, NY. Gusts peaked at 186 mph at the Blue Hill Observatory in Massachusetts. It produced a storm surge from 14 to 17 feet. Twelve new inlets formed from the storm from Fire Island to East Hampton from the wind and wave action, but most filled up with debris and tons of sand. The most notable was Shinnecock Inlet because it remained open and still exists today.

This hurricane occurred well before the age of satellites, and so monitoring of tropical systems could only be done through ship reports and land-based weather observations. Exact positions on this storm could only be estimated depending on the number of ship reports. In this case the estimates were further hindered by the fact that the Jacksonville, FL Weather Bureau office had understandably told mariner's to stay in port, so there were few reports to work with. This was also before tropical storms were named.

The National Weather Service Office in New York City has a great web site on this storm. It includes meteorological analysis and statistics, photos, news clippings, and even some video of film taken during the storm. Check out The Great New England Hurricane of 1938.

Thursday, September 19, 2013

All That Water Has to Go Somewhere


The flooding in Colorado caused by last week's unprecedented rainfall is subsiding. While the worst of the actual flooding has passed through Colorado, the tremendous amount of damage caused will take months to years to repair. Some of the landscape has been re-shaped and may remain that way. An unimaginable amount of water flushed through northeastern Colorado. Where is it going?

Eventually, some of that water will end up in the Gulf of Mexico. The flood surge is currently moving down the South Platte River in Nebraska, eventually to the Platte River, then the Missouri, and then into the Mississippi.

The drainage basin of the South Platte River
The South Platte River is located in Colorado and Nebraska. Its drainage basin includes much of the eastern flank of the Rocky Mountains in Colorado, including the Front Range and the eastern plains. The source of the South Platte is just south of Denver. It also drains a portion of southeastern Wyoming in the vicinity of the city of Cheyenne. It joins the North Platte River in western Nebraska to form the Platte, which then flows across Nebraska to the Missouri.


The rain last week fell not only over the tributaries of the South Platte such as the Big Thompson and Poudre Rivers (and many others), but very near its source.

The South Platte drainage basin with the approximate areas of the heavy rain.
The darker green areas are those that received the largest amounts of rain.

The progress of the floodwaters from the rain in Colorado can be tracked by the river gauges along the South Platte. This flooding has not been the often gradual rise in river levels you might typically see along the larger rivers in the spring. This flood is more of a pulse, a rapid rise in a short amount of time. This hydrograph from Roscoe, NE, just east of Ogallala, shows the rapid rise in river level. The river rose 4 feet (from 1.6 feet to 5.6 feet) in just two hours, and 6 feet in less than 12 hours.  It's expected to rise another 5 feet cresting at a record 12.5 feet today.

Hydrograph from Roscoe, NE.
Source: NWS Advanced Hydrologic Prediction Service


Similar rises have and will occur along the river as the surge of floodwaters moves down river. However, as the water moves into the Platte River and eventually the Missouri the rises will be more gradual.  Unfortunately, the river levels will fall a lot more slowly than they came up due to the huge volume of water draining out of Colorado.

Here is a satellite image of eastern Colorado and western Nebraska where you can actually see the leading edge of the floodwaters moving down the river. The high contrast between the swollen parts of the river and downstream is due to the large amount of sediment and debris carried by the floodwaters and the wider channel.

Source:  NWS North Platte, NE

The image below was compiled by the NOAA Cooperative Institute for Meteorlogical Satellite Studies (CIMSS) at the University of Wisconsin-Madison. This image is a loop of the unannotated image above with a second image taken on September 18.  You can see the leading edge of the flood has crossed into Nebraska on the second image.


To see the full-size image of this loop (large file), go to the CIMSS Satellite Blog.

You can follow the progress of the floodwaters through the river system on the NWS Advanced Hydrologic Prediction Service web site.

Monday, September 16, 2013

Records Fall in Colorado and New Mexico

It didn't take long for Boulder to set a new annual rainfall record - one day, in fact. Boulder received another 1.0 to 2.70 inches of rain in the 24-hour period ending this morning, with 1.94 inches recorded at the U.S. Cooperative Network station. That brings the September total to 16.69 inches of rain for the month, and the annual total - so far - to 29.65 inches for the year to date. That amount breaks the old record of 29.43 set in 1995, and it will only go up from there. The 16.69 inches of rain at the Coop site is far from the highest in the Boulder area. Eight CoCoRaHS observers have more rain during the month, with two observers reporting more than 20 inches.  The observer at CO-CO-33 (Boulder 3.3 SE) has received 21.15 inches in September.  Boulder was not alone in getting more unwanted rain yesterday. One to two inch amounts were recorded from Colorado Springs north to Fort Collins.


The rain hampered rescue and recovery operations for the flooding. The flooding in Colorado has already claimed seven lives and an estimated 1,200 people are unaccounted for.  Only scattered "pop-up" showers and thunderstorms are expected along the front Range the next 36 hours, with dry weather the rest of the week.

While most of the attention has been focused on Colorado, the same weather pattern resulted in heavy rain and flooding in New Mexico this past week. Some locations have received more than 10 inches of rain, with the CoCoRaHS observer at NM-ED-18 (Carlsbad 33.3 WSW) picking up 11.39 inches of rain in a three-day span.


7-day precipitation ending 6:00 am MDT on 9/16/2013
 
Recall that New Mexico earlier this summer was ground zero for the drought in the west . Drought is still pervasive across the state, although conditions have improved since June. 

The rain this week resulted in heavy runoff swelling rivers and streams. Albuquerque has received 3.35 inches of rain this month, three times normal. It is also the wettest September on record, breaking the old record of 3.31 inches in 1929. The normal annual precipitation for Albuquerque is only 9.45 inches.

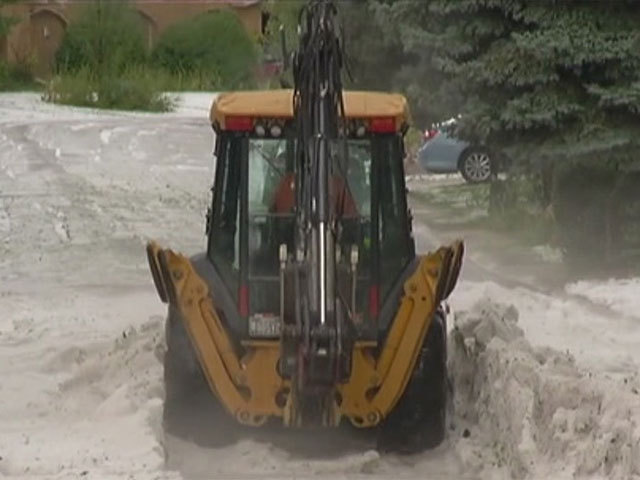
Saturated soils and runoff have contributed to flooding of low lying areas, and floodwaters have broken through dams, inundating neighborhoods and leaving behind mud and debris. The flooding forced evacuations in some areas, and flooding on the Gila River closed the Gila Cliff Dwellings National Monument. There was one fatality attributed to the flooding.

The rain has put a big dent in the drought, but it will need to be sustained over a longer period to begin to turn things around. Here are two water balance charts for CoCoRaHS station NM-BR-56 (near Albuquerque).  The first shows the balance beginning August 1st. Rain over the last 45 days has brought a significant improvement in short term conditions.


If we extend the water balance chart back to May 15, the improvement is not nearly as remarkable.  Since May 15 the water balance (precipitation minus evaporation) is -15.40 inches, and it will take much more rain over a longer period to eat away at that deficit.


Saturday, September 14, 2013

A Year's Worth of Rain in One Week - Colorado Flooding

The devastating flooding along the Colorado Front Range has been headline news this week. No doubt most people have seen photos and video of the flooding and damage - they are all over social media as well as the typical news sites. If you have ever doubted the power of water the images coming out of Colorado should put those doubts to rest. The flooding extends from the Fort Collins area south to the west side of Denver.  The same rivers that bring spring meltwater out of the mountains to irrigate farms and fill community reservoirs along the Front Range are now raging torrents that have washed out roads and isolated many communities.

This image shows large portions U.S. 34 washed away at the mouth of the Big Thompson canyon

While a large area has been affected by flooding, Boulder, Colorado was the epicenter for the heaviest rain. Here are some climatological facts for Boulder rainfall to help place this in perspective

Boulder's annual precipitation averages 20.68 inches, with an average of 1.68 inches in September.
For September 1-13, the U.S. Cooperative Weather Station in Boulder has received 14.74 inches of rain. This nearly three times the previous monthly September record of 5.50 inches in 1940! This is also the wettest month ever on record for Boulder. The previous record was 9.59 inches in July 1995.

Much of Colorado has been in severe drought or worse for more than a year, and Boulder and much of the area was on track for another very dry year. Through the end of August, Boulder's precipitation for the year was 12.96 inches, which placed it in the top 30 percent of driest years in Boulder.

With the precipitation through September 13th, the total precipitation for the year so far is 27.70 inches, which now makes this year the second wettest on record. The wettest year on record is 1995 with 29.43 inches. There is no question that 2013 will eclipse this mark - the only questions are by how much and when.

Not only did the rainfall so far this month destroy the previous monthly record, but the 9.08 inches recorded on September 12 shattered the precious record of 4.80 inches measured on July 31, 1919..

Source:  National Weather Service Denver/Boulder

While the U.S. Cooperative station in Boulder is the official record, rainfall totals measured by CoCoRaHS observers were just as if not more impressive. Here are the rainfall totals of 10 inches or more for the period September 9-14.

Station No.Station NameTotal Precip# of Reports
 CO-BO-33 Boulder 3.3 SE18.366
 CO-BO-72 Boulder 1.3 NW15.456
 CO-BO-299 Boulder 3.0 S15.295
 CO-BO-9 Boulder 1.4 NNW15.056
 CO-BO-4 Boulder 2.9 S14.796
 CO-BO-35 Boulder 1.5 NW14.756
 CO-BO-14 Boulder 1.6 S14.715
 CO-BO-286 Boulder 3.5 S14.566
 CO-BO-321 Boulder 1.7 S14.135
 CO-BO-337 Boulder 1.6 NW14.065
 CO-LR-907 Livermore 10.6 W13.954
 CO-BO-288 Boulder 0.5 NNE13.886
 CO-BO-120 Boulder 3.0 E13.804
 CO-AD-127 Aurora 4.2 NNW13.746
 CO-BO-74 Boulder 5 SE13.725
 CO-AD-170 Aurora 4.5 NW13.135
 CO-BO-234 Louisville 2.5 NW13.015
 CO-BO-282 Boulder 4.4 S12.995
 CO-BO-164 Boulder 3.0 NNW12.796
 CO-BO-230 Boulder 6.8 WNW12.285
 CO-BO-219 Riverside 2.2 NE12.153
 CO-AR-55 Aurora 2.9 NW12.114
 CO-BO-349 Boulder 1.2 N12.103
 CO-BO-67 Boulder 4.7 E12.005
 CO-BO-243 Louisville 2.6 WSW11.915
 CO-BO-202 Ward 4.6 NE11.676
 CO-AR-99 Aurora 4.1 S11.426
 CO-BO-135 Boulder 5.4 ESE11.136
 CO-DN-183 Denver 5.1 ENE11.085
 CO-JF-365 Golden 2.1 SW10.996
 CO-AR-270 Aurora 0.7 WSW10.806
 CO-AR-262 Aurora 2.1 W10.786
 CO-LR-749 Drake 4.7 SSE10.683
 CO-AR-281 Aurora 2.4 SW10.625
 CO-LR-882 Loveland 12.2 W10.546
 CO-BO-19 Boulder 4.6 E10.455
 CO-JF-63 Golden 4.8 NW10.396
 CO-JF-279 Pinecliffe 3.1 ESE10.275
 CO-LR-866 Estes Park 2.2 S10.056
 CO-AR-264 Aurora 3.8 S10.036

Forecast surface map for 12 noon MDT Sunday, September 15
It is raining along the Foothills today, and another round of showers and thunderstorms are expected tonight through Sunday. A cold front will move into northern Colorado tomorrow. Developing easterly and northeasterly winds will force moist air to be lifted along the mountains producing convection that will linger into Monday. Dry weather will finally return to Colorado as high pressure sets up over the state.


Quantitative Precipitation Forecast for the 48-hour period ending 6:00 p.m. MDT Monday, September 16.

Thursday, September 12, 2013

Front Range Flooding - CoCoRaHS Deja Vu

500 millibar map for 6:00 a.m. MDT September 12
An upper level low over the southern Great Basin has been funneling moisture northward along the
Rocky Mountains, producing a conveyor belt of thunderstorms that have dropped up to a foot of rain on some locations in the past few days . The most recent event is the widespread and destructive flash flooding that occurred in the foothills from Boulder to Fort Collins, CO Wednesday night and Thursday.   24-hour rainfall amounts in Boulder County this morning exceeded eight inches, with a relatively narrow band of 7.00 to more than 8.00 inches of rain through the city of Boulder.

24 hour rainfall ending at 0700 MDT September 12

The rain gauge at Centennial Middle School in Boulder, CO (CO-BO-337) this morning with 8.43 inches of rain.


The radar-estimated precipitation map for the period from September 9 through 10:00 a.m. MDT September 12 (just a little less than three days) shows the two bands of heavy rainfall, one northwest of Denver and the other just east.

Radar estimated precipitation from the Denver NWS radar
Normally trickling rivers at this time of year became raging torrents, and the flash flooding washed out many roads, flooding many communities and isolating others. At least three people have lost their lives in the flooding.  Emergency personnel conducted numerous water rescues. The main business district in Estes Park, CO, the gateway to Rocky Mountain National Park, was wall to wall water this morning. More rain fell during the day Thursday and is expected to continue into Friday.


The flooding the last two days is much like the heavy rainfall event that is behind the formation of the CoCoRaHS program. on July 28, 1997 a major flash flood hit Fort Collins causing devastation in excess of $140 million and five fatalities.


It was the attempt to document and explain this event that is behind the origins of CoCoRaHS. Rainfall data was available from only a few "official' rain gauges. In this situation rainfall varied from 2 inches to more than ten inches over a distance of about three miles, and none of the official gauges captured the rainfall maximum.  You can read more about the rainfall for this event at this link:  An Analysis of Rainfall for the July 28, 1997 Flood in FortCollins, Colorado.

An excellent source of information on rainfall-induced floods that have caused damage in the Front Rain since 1953, including the 1997 Fort Collins flood, can be found on the Colorado Front Range Historical Flood Summaries web site provided by the National Center for Atmospheric Research. There is little doubt that this week's flooding will make its way on to the list.

Wednesday, September 11, 2013

Hail Storm in Denver

Hail covers the ground on the west side of Denver September 9.
Credit: thedenverchannel.com
No, this is not a photograph of Denver during the winter. It's a photo taken Monday of hail covering the ground in the Denver Metro area. Thunderstorms left piles of hail up to five feet deep and produced flooding in Lakewood, Golden and Wheat Ridge.

There have been some impressive hail storms reported this year (New Mexico, Calgary) and this one is in that class. Winds on the west side of the ridge over the central U.S. have been pumping moisture from the Pacific across Mexico into Arizona and Colorado (the seasonal monsoon). The moisture has been fueling thunderstorms over this region the past few days and for a few more days to come.

Satellite water vapor image for 2:45 p.m. MDT Monday, September 9.
White and pink colors indicate moisture. Red and oranges depict dry air.
From NCAR Real-Time Weather Data web site.


Thunderstorms Monday afternoon produced frequent lightning, torrential rain and hail heavy enough to cover the ground in many places on the western edge of Denver.  Fortunately, according to hail reports submitted by CoCoRaHS observers most of the hail was pea-size (1/4") with some up to 1/2", and most of the damage was leaf damage. However, streets flooded as hail and debris clogged storm
drains.
"Hail floes" float on water covering street. Credit: thedenverchannel.com

Front-end loaders, backhoes, and dump trucks had to be used to clear streets where the hail had piled up to as much as five feet deep. In addition to the hail and the flooding the storms knocked out power to 9,600 power customers in the area.

Hail piled up on a street in Lakewood, CO.  Credit: thedenverchannel.com