Wednesday, August 27, 2014

Musings on Heavy Rain

As I watch the rainfall reports coming in from around the country this month it seems like almost every day there is some place with excessive rainfall. Of course, the whole country hasn't experienced heavy rain this month. California, Oregon, Washington and other western states would give anything to have some of the rain that has occurred. I've written about a couple of these events, but I was curious to know on how many days there were reports of heavy rain, where, and how much.  So, I dug into the CoCoRaHS data and came up with a few interesting facts.

I defined my "heavy rain" amount as equal to or greater than 3.00 inches. That's a pretty decent amount almost anywhere for 24 hours, and if it falls fast enough it can cause problems.  I constructed a table showing the daily maximum values, the number of precipitation reports of 3 inches or more, and the states reports were received from.


Date Max Precip in. State #>=3in States/Provinces
8/1/2014 7.43 SC 75 FL LA NC PR SC TX
8/2/2014 4.96 NC 31 HI LA NC NM PR TX VA
8/3/2014 6.37 NC 24 FL GA NC PR
8/4/2014 6.95 FL 20 FL LA MS NC NY
8/5/2014 7.00 FL 17 FL IL ON
8/6/2014 5.65 ND 11 FL IA ND NE SD
8/7/2014 5.29 MO 40 IA KS MO
8/8/2014 7.96 HI 24 AL CO GA HI IL MO
8/9/2014 5.86 HI 23 AL AR GA HI KY NE NL SC TN
8/10/2014 6.96 SC 54 AK AR GA IL KS LA NC NE NM SC SD
8/11/2014 6.35 TN 28 AK AL GA IN MN MO MS NC SC TN
8/12/2014 8.03 MD 54 FL LA MD MI MS NC OH ON SC TN VA
8/13/2014 13.02 NY 137 AZ DE FL MD ME NC NJ NY PA SC VA
8/14/2014 6.22 ME 57 CT MA ME NH RI
8/15/2014 4.47 FL 4 FL SD 
8/16/2014 8.00 ND 31 CT FL IA MO ND
8/17/2014 4.50 ND 6 FL IL MO ND TX
8/18/2014 5.43 TN 20 AR MN MS NS TN
8/19/2014 8.10 NC 60 AL MI NC SC TN TX WI
8/20/2014 4.85 NC 5 MI NC OH TX
8/21/2014 4.20 MAN 4 HI MAN ND
8/22/2014 10.63 IN 133 IL IN NC NJ OH PA
8/23/2014 4.96 PR 25 IA IN KS KY MD MT NE PA PR WV
8/24/2014 5.86 MT 46 FL IL IN MT NC ND PR SC SD
8/25/2014 3.97 GA 6 GA MT  SASK TN WI
8/26/2014 4.93 NE 7 FL IA NE
8/27/2014 3.11 IL 2 IL MO

So far this month every day has had at least one report of 3 inches or more of rain. You can see when the larger (in terms of area) events occurred.  On August 12th there were 137 reports of 3 inches or more of rain. This was from the slow moving storm that moved up the east coast from Virginia to Maine that week. However, one contribution to this high number of reports is likely due to rain gauge (population) density. There were many more gauges sampling the storm that week in the east than, say, Wednesday 8/26 in Illinois. As of this posting there were only two reports of 3 inches of rain or more this morning, but there would have probably been more if we just would have had some gauges underneath those slow moving storms yesterday. According to the multi-sensor precipitation map for yesterday there were 3-inch plus amounts  in central Illinois, in northwest Missouri, the Oklahoma panhandle, and in central New Mexico.


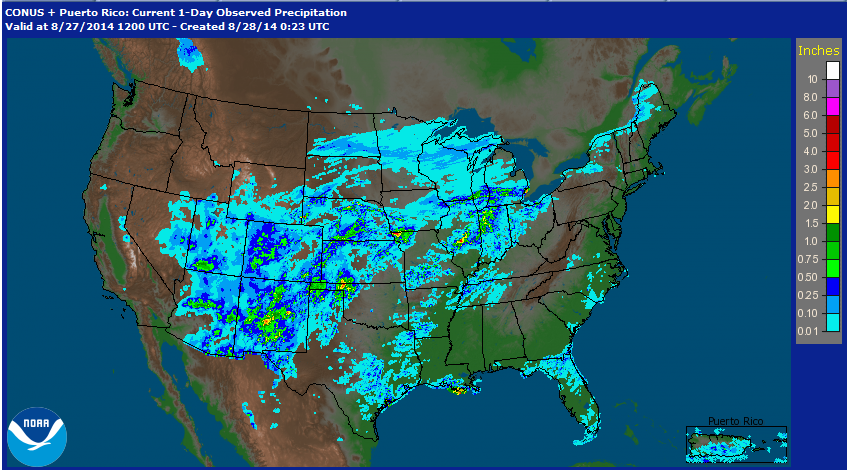
However, there were no CoCoRaHS gauges capturing those 3 inch plus amounts in Oklahoma and New Mexico. NWS Cooperative observers in Atchison, MO received from 3.5 to 4.5 inches of rain in the 24-hour period ending this morning.

So far this month heavy rain has been reported in 42 states, 5 Canadian provinces, and Puerto Rico.

So how does this compare to the past several years? In 2011, 26 days had an observation of 3 inches or more, and in 2012 through 2014 each day from August 1-27 had at least one observation 3 inches or more. (I did not go back further since the number of active stations was much less in prior years.) Here is a chart showing the distribution of CoCoRaHS observations at different rainfall amounts for those years.

I don't think you can really draw any conclusions from all of this other than the fact that these heavy rain events occur frequently this time of year across much of the country and this year is not much different from the last few years. These are only the CoCoRaHS observations, and the raw numbers would look different (higher amounts on more of the days) if we included all of the NWS Coop observations. It's just an interesting way to look at the tens of thousands of CoCoRaHS observations our volunteers submit each month and an example of how important your observations are to describing the precipitation climatology.

Wednesday, August 20, 2014

Deluge in the Valley of the Sun

Last week exceptional rains occurred in the central and eastern U.S.  This week the weather eye turns to, of all places, the Desert Southwest. For most of the year "rain" and Arizona" are two words rarely heard in the same sentence.  However, the summer monsoon is in full swing, and on Tuesday the Phoenix area received some impressive rain amounts which caused major flooding on some creeks and rivers as well as flooding of many roads, including portions of Interstate 17.

The thunderstorms were set off by an approaching trough over the western U.S. With ample moisture available from the monsoonal flow and southwesterly winds forcing the air up over higher terrain, thunderstorms quickly developed and intensified.

The first round of storms occurred early Tuesday morning near Carefree and Cave Creek, located at the northeast corner of the metro area.
 
Radar reflectivity for 6:02 a.m. PST Tuesday, August 19. Storms are intensifying west and north of Phoenix.

By 7:00 a.m. very heavy rain was falling northeast of Phoenix over the higher terrain of Maricopa County.


Radar reflectivity for 7:02 a.m. PST Tuesday, August 19.  Heavy rain is falling east of I-17 and north of Phoenix.

The CoCoRaHS observer at Cave Creek 2.9 SSW (AZ-MR-17) reported 0.75 inch of rain in 15 minutes (that's a rate of 3 inches per hour) as did the observer at Carefree 2.1 E (AZ-MR-31). Both stations ended up with about 2 inches of rain. However, the heaviest rain was located north of our CoCoRaHS observers.

Initially floodwaters and debris covered the northbound lanes of Interstate 17, but by 10:00 am Interstate 17 four miles north of New River was totally under water and many cars were stranded, necessitating rescues.

Water covers the northbound lanes of I-17 Tuesday morning.
Credit: ABC15 Facebook page


A second round of heavy storms moved over the same area northeast of Phoenix during the early afternoon, and additional thunderstorms moved through the region though the afternoon and evening. However, most of the rain fell in these first two rounds.


Radar reflectivity at 12:02 p.m. PST on Tuesday, August 19.
A second round of heavy storms is moving through the Phoenix area.

Measured ainfall totals for this event reached 5.51 inches at Tower Mountain north of Phoenix, but there was a wide swath of  4-inch plus rainfall that extended to the southeast from there. The highest amount reported by a CoCoRaHS observer was 2.86 inches at Cave Creek 2.4 N (AZ-MR-163).

24-hour rainfall map for period ending the morning of August 20.
Area outlined in orange encloses rainfall amounts of 4 inches or more.
Base map credit: Flood Control District of Maricopa County

The National Weather Service Office in Phoenix has a web page with more information on this event, including photos of the flooding.

Thursday, August 14, 2014

Too Much Rain

Spectacular flooding rains occurred in several parts of the country in the past few days. On Friday night and early Saturday morning two rounds of heavy thunderstorms hit Kearney, NE. CoCoRaHS observers in and around Kearney reported from, 2.35 to 3.89 inches of rain for the 24 hours ending Saturday morning. Most of it fell in a span of a little more than three hours from 11:00 p.m. to 2:00 a.m.

Radar reflectivity for 11:14 p.m. CDT August 9 (left) and 1:18 a.m. August 10 showing storms approaching
Kearney, NE (inside white circle)

The rain caused flash flooding as you might expect as the amount of water exceeded the capacity of storm sewers to drain it away. You probably have seen this video - it's making the rounds on the Internet, but just in case you haven't I've included it here. A security camera at Good Samaritan Hospital in Kearney captured flood waters bursting through windows on the lower level of the hospital flooding the cafeteria and other areas.


Surface weather map for 8:00 EDT on Monday, August 11, 2014
On Monday, August 11 a nearly stationary low pressure wave along a front in the Midwest helped generate thunderstorms that dumped more 4 to 6 inches of rain across southeastern Michigan in a matter of four hours. One of the worst hit areas was the Detroit Metro area. The Detroit Airport received 4.57 inches of rain, setting a new daily record. The old record was 2.06 inches in 1964. This was also just 0.14 inches short of the all-time daily rainfall records. Daily rainfall records were also set at Flint and Saginaw. The flash flooding from these thunderstorms quickly inundated roads and highways. There were 17 CoCoRaHS reports of rain 4 inches or more with the highest amount 6.31 inches at MI-WY-7 Dearborn 3.5 NE. The water was so deep in some areas that the Michigan State Police sent divers to check flooded freeways in the Detroit area to make sure no one was trapped in vehicles. More information on this event, including many photos, can be seen on the August 11, 2014 Historic Rainfall Event page on the NWS Detroit/Pontiac web site.


Then, Tuesday through early Wednesday morning very heavy to extreme rainfall occurred from the mid-Atlantic into southern New England. This rain resulted from the same system that affected Michigan on Monday. The cold front extended along the Appalachians Tuesday evening, with warm, very moist air feeding into it from the Atlantic and the surface low moving east through northern Virginia.


Surface map for 2:00 a.m. EDT, August 13, 2014
In the upper atmosphere, an unseasonably strong trough extended south from the eastern Great Lakes. This trough produced strong upward motion of the air ahead of it, and all of these components came together to produce inches and inches of rain. This water vapor satellite image shows setup Tuesday night night.

Water vapor satellite image.  Green arrows indicate the wind flow. The divergent wind flow from the mid-Atlantic up through New England helped produce the strong lift needed to generate the heavy rain.

Here is the 500 millibar chart for about the same time;

500 millibar chart for 2:00 a.m. EDT August 13, 2014

In the Baltimore-Washington area flash flooding snarled traffic and caused numerous other problems. Rainfall amounts were in the 3 to 5 inch range around Washington DC, but in Maryland amounts were higher. Several Maryland CoCoRaHS observers reported more the 7 inches of rain,and the highest amount reported was 10.32 inches near Greenhaven in Anne Arundel County.


The band of heavy rain extended from Baltimore-Washington northeast across southern New Jersey and across western Long Island. For more information on the rain in New Jersey, see this special report by the New Jersey State Climate Office. The band was quite narrow, and amounts rapidly fell off as you went north and west from the rain band.

Radar estimated precipitation from the radar at Upton, NY from about midnight on August 12 to noon EDT on August 13.

Long Island showing location of Islip
and CoCoRaHS precip reports
The 24-hour rainfall at the Islip Macarthur Airport on Long Island was 13.57inches as of 9:30 a.m. this morning, and is a new 24-hour New York state precipitation record. The previous record was 11.60 inches at Tannersville, NY on August 27-28 during Hurricane Irene. The daily record was also set at Islip, with 13.51 inches. This amount obliterated the old record of 0.91 inch. The total for the month (so far) for Islip is 14.03 inches, a new record.  The old record was 13.78 inches in August 1990.

On Wednesday the heavy rain shifted further northeast into southeast Maine, where upwards of 6 inches of rain accumulated by this morning.

CoCoRaHS map for Cumberland County, Maine for August 14, 2014.

If you would like some quick summary information on flooding and its causes and costs,Weather Underground has a nice "poster type" web page on floods.

Wednesday, August 6, 2014

Hawaii Braces for Tropical Punch

The Atlantic may be quiet as far as tropical activity is concerned, but that is not the case in the Pacific. There are currently three systems in the central Pacific, and two of them are posing a threat to the Hawaiian Islands.


Genevieve, the furthest west storm and the strongest of the three with sustained winds of 135 mph, is located about 1680 miles west southwest of Hawaii. All eyes, however are on Hurricane Iselle and Hurricane Julio.  As of 5:00 p.m. HST  (11:00 p.m. EDT) Hurricane Iselle was was 510 miles east-southeast of Hilo. The maximum sustained winds in Iselle were 90 mph, and it's forward speed was to the west-northwest at 18 mph. At this rate Hurricane Iselle will reach the Big Island on Thursday. Iselle is expected to maintain strength.  A hurricane warning is in effect for the Big Island and surrounding waters, and a tropical storm warning is in effect for all the remaining islands except Niihau and Kauai, where tropical storm watch is in effect. Although the exact storm track is far from certain, heavy rain, heavy surf, and damaging winds are expected to spread across the island tomorrow and Friday.


5-day forecast track for Iselle as of 5:00 p.m. HST (11:00 p.m. EDT) today.
If you look at the satellite image of the storms above and the location of the Hawaiian Islands, it's not hard to realize that hurricanes are relatively rare in Hawaii. It's a small target in a very big ocean. The average climatological hurricane track in the central Pacific is located to the south of Hawaii. In addition tropical systems that approach Hawaii from the east tend to weaken because of unfavorable wind shear and cooler sea surface temperatures. The last time a hurricane made landfall in Hawaii was in 1992 when Hurricane Iniki made landfall in Kauai in early September. This category 4 storm took 6 lives and caused $1.8 billion in damage.

Satellite image of Hurricane Iniki on September 11, 1992.

So, right now we have one hurricane bearing down on the islands, and a second one following close behind. It's unusual enough to have two tropical systems to hit Hawaii in one season, much less in the span of three days.

At 5:00 p.m.. HST (11:00 p.m. EDT) Hurricane Julio was located 1555 miles east of Hilo, moving to the west northwest at 16 miles per hour. Residents of Hawaii will get about 24 hours or so to get ready for Julio after Iselle passes through. The present forecast brings the center of Julio just to the north of the islands late Saturday and Sunday.

5-day forecast track for Hurricane Julio issued at 11:00 p.m. EDT.
Of course, the exact track of both storms is still uncertain at this time, but it appears that Hawaii is in store for a one-two tropical punch over the next four days.

Information on Hurricane Iselle can be found on the NWS Central Pacific Hurricane Center web site. Information on Hurricane Julio is available on the National Hurricane Center web site   Once Julio moves west of 140°W longitude, the Central Pacific Hurricane Center will take over monitoring and forecasting responsibilities for this storm.

The latest watches, warnings, and advisories for the Hawaii can be found on the NWS Honolulu web site. The information I've included about the storms is valid as of late on August 6, so be sure to check these web sites if you are interested in the latest updates.