Thursday, October 29, 2015

A Week of Rain Reduces Drought

A week of rain associated with an upper level trough moving across the U.S. interacting with moisture remaining from Hurricane Patricia brought significant reduction in drought conditions across the southern Plains eastward into the southeastern U.S.


The Drought Monitor (l) and weekly change (r) as of October 27.

Parts of the Midwest and Ohio Valley shown in drought received one to four inches of rain after the Drought Monitor was finalized and will likely show some improvement in next week's map.


In the Caribbean, another upper level trough brought heavy rain to Puerto Rico, though the southern coastal region, where drought is in the Extreme category, missed out on much of the rain.  


Location of Navarro County
The week started with heavy rain in Texas on October 22 and October 23 as an upper level trough dropped south though the Rockies. Rain became more widespread and heavier as this trough began to tap in to the moisture from Patricia as is streamed northeast from Mexico. Eastern and southern Texas endured several days of rain which caused widespread flash flooding. The highest amounts were found  in east-central Texas where two CoCoRaHS stations reported almost two feet of rain in Navarro County between October 22 and October 26.


The highest rainfall totals for the period October 22-October 29, 2015 in Texas.

The upper trough and associated surface low slowly crawled east during the week, producing heavy rain over Louisiana, Arkansas and the Ohio Valley, and eventually into the eastern seaboard. A well defined low formed along the Texas Gulf cost on Sunday, October 25.

Surface map for 10:00 a.m. CDT October 25, 2015

 On Monday, October 26 the surface low was still well-defined on satellite over southern Louisiana.

Visible satellite image for 1:15 p.m. CDT on October 26, 2015.

Rainfall over eastern Texas, Louisiana, and Mississippi ranged from 5 to 10 inches on October 26. Two to five inches of rain fell from Mississippi east through Florida on October 27. As the upper trough over the middle of the country deepened rain shifted into the Ohio Valley and east through North Carolina with 3 to 6 inch amounts. In response to the deepening upper level trough a strong surface low developed over the Great Lakes. Heavy rain yesterday and last night was reported from the Great Lakes to New England, with 3 to 4 inches from New Jersey to Vermont. Enough cold air was pulled in behind this system to bring 1.5 to 2.0 inches of snow to parts of Minnesota and Wisconsin.

Sequence of CoCoRaHS precipitation maps for October 22 through October 29.

A large trough aloft is forecast to develop along the west coast this weekend, and that's setting the stage for more rain in the same areas that were drenched this week. This system will also bring rain to the Pacific Northwest and scattered rainfall to California.

Quantitative Precipitation Forecast for the 7-day period ending at 6:00 p.m. CDT November 5, 2015


Monday, October 26, 2015

The Short but Spectacular Life of Hurricane Patricia

Hurricane Patricia as seen from the International Space Station
on October 23.
Photo by Astronaut Scott Kelly
Most of the weather buzz on Friday, both on social media and in the news, concerned Hurricane Patricia. This storm was born a tropical depression with winds of 35 mph on Tuesday morning, October 20, and by late Thursday evening it was a Category 5 hurricane with sustained winds of 160 miles per hour. It continued to grow from there to become the strongest hurricane ever recorded in the eastern Pacific, peaking at sustained winds of 200 mph and a central pressure of 879 millibars. It made landfall along the Mexican coast between Manzanillo and Puerto Vallarta.


Patricia's four-day lifetime was not that unusual in itself. However the rate of intensification, a pressure drop of 100 millibars in 24 hours, may be a new record, and the strength of the storm was a record for the eastern north Pacific and is the third strongest tropical cyclone on record. Supertyphoon Nancy in 1961 produced winds of 215 mph to top the list. Patricia is the strongest hurricane ever recorded in the Western Hemisphere. The lowest pressure recorded in Patricia, 879.4 millibars broke a record that was set in 2005 when Hurricane Wilma bottomed out at 882 millibars.

Chart showing the history of Hurricane Patricia taken from 6-hourly updates from the National Hurricane Center.


All of these records are still provisional until data is analyzed and final.

Patricia's incredible intensification and record strength were fueled by extremely warm waters over the eastern Pacific. Sea surface temperatures were in the mid 80s, and the layer of warm water was deep. This limited the amount of cooling due to upwelling, or the transport of colder deep water to the surface. Upper level wind shear (increasing speed with height) was also minimal, and together with abundant moisture these conditions contributed to unimpeded intensification.

Sea surface temperatures over the Pacific showing temperatures 30°C (86°F) off the Mexican and Central America coasts


Patricia made landfall at about 6:15 p.m. on Friday, October 23, about 55 miles west-northwest of Manzanillo, Mexico near the town of  Cuixmala. Sustained winds at landfall were estimated at 165 mph, although a weather station located at Chamela-Cuixmala recorded sustained winds of 186 mph at 5:50 p.m. CDT, and winds greater than 160 mph for more than an hour.

Some have called the designation of Patricia's impact as potentially "catastrophic" as over-hype. However, the observations alone mentioned in the preceding paragraph counter this characterization as well as the destruction experienced by the towns and villages in the area Patricia made landfall. Patricia did make landfall in a sparsely populated  region. Had this hurricane made landfall further north or south, directly affecting the much high population densities in Manzanillo or Puerto Vallarta, the impacts could have been more devastating.

Graphic credit: Mike Lowry via Twitter/Weather Channel

As of this writing six deaths have been attributed to the storm in Mexico. Destruction to trees and structures near landfall is extensive, both from the wind and from the storm surge. So far I have not seen any figures on the height of the storm surge, but witnesses reported seeing a wall of water. The Mexican Water Commission warned of waves as high as 39 feet. Storm chaser Josh Morgerman provided this account of Patrica's landfall near "ground zero". You can follow Morgerman on Facebook at iCyclone.


Hurricane PATRICIA. All I can say is: terrifying storm.
    After an hour or two of violent, destructive winds in Emiliano Zapata (our location: 19.38973N 104.96391W), the pressure bottomed out at 937.8 mb at 6:12 pm. We saw brightness in the sky and some touches of blue, and while the wind was still dangerous, it seemed to be a little less energetic for a few minutes. (I notice that the NHC's landfall point was *very* close to us! So it looks like we might have been skirting the edge of the eye at this time.) Then the pressure started to rapidly rise, and I assumed the worst of the hurricane had passed. Actually, it hadn't started. (Ugh.)
    At 6:34 pm the wind shifted sharply to the W, and a wall of wind and rain swept in, engulfing the hotel with a howling, whistling sound. There was a complete whiteout. The building trembled. Things were crashing-- big crashes as the hotel started to blow apart. Erik and I retreated to our room. A frightened hotel worker joined us and we stood in the dark, not sure what to do. We heard a terrific explosion and assumed the roof had blown off. (We were right.) Minutes later a man burst into the room-- a family across the hall was in trouble-- their room had torn open-- roof, ceiling, and all had blown away. Erik rushed across the hall-- which was now a wind tunnel-- and helped them into our room. Then all of us-- six adults and two children-- crammed into the tiny bathroom: the family around the toilet, Erik and me in the shower stall, two hotel workers next to the sink, all of us pressed against each other in the darkness like trapped animals. Roaring. Crashing. The mother wept-- she was freaked out. I told her not to worry-- told her (in broken Spanish) we were totally safe-- but I was talking nonsense, telling a lie. More crashing. We put pillows and blankets over the children, and Erik and I put computer bags over our heads and got low. Water was streaming from the ceiling and we expected it to blow away any second. So Erik and the two workers and I pulled the mattress off the bed and squeezed it into the bathroom. We tore the shower doors out to make room, then lifted the mattress up over everyone and wedged it in to make an extra ceiling. And we waited.
    The howling continued, but the pressure was rising fast-- into the 960s, then '70s-- and I knew we'd clear the core soon... just a few more minutes of this insanity. And by maybe 7 pm or so, we did. We crept out to look at the devastation-- smashed rooms, mountains of debris, trees stripped bare. And as it got dark the wind slowly calmed... And we had a tranquil night sleeping on a damp mattress, the crickets chirping all hours in the black, sticky calm.
    On a meteorological note: The pressure gradient in the core of this cyclone was frightening. The pressure recovered explosively-- 31 mb in 26 minutes (6:24 - 6:50 pm) (!!) and an incredible 15 mb in just 9 minutes (6:34 - 6:43 pm) while the winds ripped apart the hotel. It was an incredible, frightening experience (and honor) to punch the core of this Cat-5 hurricane-- the strongest known landfall ever in the Eastern Pacific. My video footage is messy, shaky, and wild, but I believe it captures the terror of the experience and I hope to post it soon.

Rainfall was heaviest along the coast. 24-hour rainfall totals ranged between 5 and 12 inches, and there were likely higher amounts in the mountains as Patricia moved inland and weakened.

Precipitation accumulation for the 24-hour period ending the morning of October 24.

Hurricane Patricia went from a tropical storm to a Category 5 hurricane in just 24 hours, and then to a remnant post-tropical low in just 12 hours. The mountainous terrain and uncoupling of the storm from the warm Pacific waters contributed to the storm's rapid decline, as is typical with tropical systems.


In the final analysis Hurricane Patricia will go down not only as the strongest hurricane recorded in the eastern Pacific, but also as one that caused much less damage and loss of life than it could have. The low population density near landfall, as well as the preparedness of Mexican authorities mitigated Patricia's impact. The population heeded warnings that were issued, and more than 15,000 people were evacuated to shelters prior to the storm's arrival. The forecasts issued by the National Hurricane Center of the hurricane's track were consistent. The models did forecast the storm to intensify but fell short of the actual intensification. Nevertheless the NHC did issue advisories indicating the storm strengthening before landfall, and the warnings communicated the extremely dangerous nature of this storm.

Thursday, October 22, 2015

A Recipe for Rain, Southwest Style

Much of Texas and the Southern Plains are currently in a worsening drought situation. The latest U.S. Drought Monitor released today shows D3 (Extreme) and D4 (Exceptional) drought from central Texas east northeast into southern Arkansas and the northern three-quarters of Louisiana.


Dryness has been slowly developing since the beginning of  summer, but the drying really accelerated in the past four to six weeks.

This map shows the change in drought status from September 22 to October 20, 2015

While Texas CoCoRaHS observers may not have been seeing much but dust in their rain gauges recently, that is about to change.  A "perfect" combination of circumstances will likely bring drought-busting rain to the region the next several days, but that has a down side as well.

The first weather feature in this recipe is an upper level trough with a closed low situated over the Four Corners. On the east side of this trough strong southwest winds are directing air into central Texas.

The 500 millibar map for 7:00 a.m. CDT October 22, 2015.

The second weather feature is Hurricane Patricia, which reached Category 4 strength this afternoon with sustained winds of 130 mph. Late this afternoon Patricia was located about 250 miles off the coast of Mexico moving northwest at 12 mph. The hurricane will turn north by tomorrow morning and likely make landfall on the Mexican coast late Friday afternoon or evening. Patricia will bring abundant moisture into Mexico, moisture that will be tapped by the trough over the southwest. Hurricane Patricia is the ninth Category 4 or 5 hurricane in the eastern Pacific this year, a new record. The latest updates on Patricia can be found at the National Hurricane Center web site.

Water vapor image of Hurricane Patricia at 1:45 p.m. PDT October 22. The eye of the storm is only 12 miles in diameter.


The third ingredient to this recipe for rain is moist flow off the Gulf of Mexico.

The 850 millibar map (~5000 feet) showing winds and relative humidity for 7:00 a.m. CDT Saturday, October 24.
Light green is RH of  =>70%, dark green is =>90%

All of this is expected to come together over Texas this weekend. The National Weather Service Office in San Antonio/Austin created a nice graphic showing how all of this is expected to come together.

This graphic shows the setup for the expected rain this weekend over Texas.

Rain is most welcome, but too much rain is not. The Quantitative Precipitation Forecast (QPF) for the three-day period ending Sunday evening at 7:00 CDT shows that much of the southeastern half of Texas will get several inches of rain, with a potential for as much as 13 inches between Austin and Dallas/Ft. Worth.

Quantitative Precipitation Forecast for the 72-hour period ending Sunday, October 26 at 7:00 p.m.


Of course this forecast may change based on how the weather features finally come together, but the primary message here is there will be lots of rain in a relatively short period, primarily from now through Saturday night. That means flooding. Just six months ago drought-ending rain occurred in Texas and Oklahoma, but it also resulted in major and in some cases record flooding on many rivers in Texas. This weekend's rain will not necessarily be a repeat of last May, providing there aren't successive heavy rain events in the next month or so. By early next week the focus of heavy rain will be southern Louisiana as the system moves east

A wide swath of central Texas and south-central Oklahoma is under a flash flood watch beginning Friday morning into Sunday. Be sure to visit your local National Weather Service web site for the latest information and updates.

Watches, warnings, and advisories in effect as of 5:08 p.m. CDT

Friday, October 16, 2015

October 15 - A Very Dry Day in North America

Precipitation map for October 15, 2015
I am always struck by the number of grey dots (zero reports) on the CoCoRaHS map when precipitation is generally absent from the map. October 15 was one of those days.  Out of 8791 reports submitted in the U.S. and Canada (as of this post), 7867, (89.5 percent) were zero reports. That's pretty remarkable in a couple of aspects. A dry day such as this is pretty rare across the continent. There have been only 14 days where there have been 80 percent or higher zero reports this year. As you can see from the chart below the vast majority of days have 60 percent or less zero reports, and it's rare to have 40 percent or less, i.e. on any day the number of zero reports is usually between 40 and 60 percent of the total reports submitted.


The day that has the highest percentage of zero reports so far this year is March 7. On that day 9348 (93.5 percent) of the 10006 reports submitted were zero reports. In terms of raw reports, May 3rd leads the list with 9588 zero reports, 86 percent of the 11215 reports submitted. What's really interesting is how similar the surface and upper air weather maps are for March 7th and October 15th.


Surface map for March 7, 2015 (L) and for October 15, 2015 (R)

500 millibar maps for March 7, 2015 (L) and October 15, 2015 (R)


We constantly remind observers that a zero report is an observation. When you submit that zero it says "I observed no precipitation". If you submit only when it rains or snows, then we don't know if days with no measurement are zero, or it's missing for some other reason. "No report" is ambiguous. Zero reports are important to drought monitoring. They are necessary for climatological calculations (daily and monthly averages, for example). On top of it all, zeroes are easy to report. When you log in to CoCoRaHS, the default precip amount is zero. Hit SUBMIT on the page and you're done.  If there is a stretch of dry weather and you haven't been able to enter your observation each day, you can use the Monthly Zeros Report to submit these. Just click the box on the dates you had zero, then submit he report. A daily report will be generated for each of those days. It can't get much easier.

How to complete a Monthly Zeros report


A couple of years ago I came up with "Be a hero, report your zero!" while encouraging an observer to report zeroes. That may be overstating it a bit, but it rhymes and gets the point across. Observers who report every day tend to have complete records, and the more complete records we have the better. Long-term records are gold to climatologists.


Tuesday, October 6, 2015

The Great South Carolina Rain

It was hard not to follow the weather events in the southeastern U.S. this past weekend. While Hurricane Joaquin grabbed a lot of the attention, the well-forecast heavy rain in the Carolinas played second fiddle for the first day or two. Hurricane Joaquin, to be sure, was no slouch and hit the Bahama Islands hard. The devastation was focused on the southeastern Bahamas, particularly Crooked Island, Acklins Island, Long Island and San Salvador. Fortunately, the hurricane stayed well away from the U.S. mainland.


While Hurricane Joaquin did factor into the record-setting rain in South Carolina, the heavy rain would have occurred without the hurricane. I wrote about the possible forecast issues with this system last week, the main concern being the stalled upper level trough in the eastern U.S. At that time it appeared that the bulk of the rain would be from North Carolina northward into New England. The trough did form a cutoff or closed low over the southeastern U.S. by Friday morning as forecast. There it sat through Saturday and Sunday, finally starting to ease out over the Atlantic Monday morning.

500 mb maps for 8:00 a.m. EDT Friday, October 2 (left) and Monday, October 5 (right).
 
A surface low was located east of the upper air low, just off the coast. There was a strong onshore flow from the surface to the mid-levels of the atmosphere.


Surface analysis for 8:00 a.m. EDT Saturday, October 6.


This system tapped very moist, tropical air over the Atlantic and setting up an atmospheric river of moisture feeding the storms over the Carolinas. The east coast system also tapped into the very warm moist outflow associated with Hurricane Joaquin. You can read some more about this interaction in this article by Dr. Marshall Shepherd of the University of Georgia.

Satellite water vapor loop showing moisture flow into South Carolina and Hurricane Joaquin.
For a more technical summary of the meteorology behind the rain this weekend in the southeast, see this article by the Capital Weather Gang at the Washington Post.

Rainfall amounts reported in eastern South Carolina - many of these from CoCoRaHS observers, were astounding, to say the least. Rainfall amounts over a four-day period exceeded two feet north of Charleston, SC, and near Columbia, SC. Here is a brief list of the highest rainfall amounts from CoCoRaHS observers in South Carolina and southeastern North Carolina.


South Carolina
Station Number Station Name Daily Precip Sum in. Multi-Day Precip in. Total Precip in. # of Reports
 SC-RC-42 Columbia 3.1 E 13.16 13.81 26.97 4
 SC-CR-69 Mount Pleasant 6.4 NE 26.88 26.88 4
 SC-CR-60 Charleston 5.4 SSE 23.61 23.61 4
 SC-WL-4 Kingstree 9.5 NW 23.35 23.35 4
 SC-CR-13 Charleston 4.6 SSE 21.88 21.88 4
 SC-CR-19 Folly Beach 2.5 SW 21.45 21.45 4
 SC-CR-89 Charleston 1.7 SE 21.34 21.34 4
 SC-HR-32 North Myrtle Beach 1.4 ENE 21.18 21.18 4
 SC-BK-29 Pineville 0.3 SSE 21.17 21.17 4
 SC-SM-10 Sumter 0.3 ENE 20.67 20.67 4
 SC-BK-38 Moncks Corner 3.6 E 20.42 20.42 4
 SC-SM-1 Sumter 1.3 SE 20.28 20.28 4
 SC-WL-2 Kingstree 7.9 NW 19.99 19.99 4
 SC-OR-5 Holly Hill 0.4 N 19.83 19.83 4
 SC-BK-44 Bonneau 2.7 NW 19.81 19.81 4
 SC-GT-13 Georgetown 4.9 NNE 19.72 19.72 4
 SC-CR-33 McClellanville 0.5 ESE 19.55 19.55 4
 SC-BK-14 Moncks Corner 3.2 NE 19.48 19.48 4
 SC-DC-37 Summerville 3.3 NW 19.47 19.47 4
 SC-CR-10 Mcclellanville 0.2 ESE 19.41 19.41 4
 SC-CD-2 Manning 8.2 S 19.25 19.25 3
 SC-CD-1 Summerton 8.4 SE 18.92 18.92 4
 SC-CR-26 Mount Pleasant 4.1 NE 18.88 18.88 4
 SC-CR-88 Charleston 2.0 S 18.84 18.84 4
 SC-CR-74 Johns Island 1.8 NE 18.79 18.79 4
 SC-GT-17 Georgetown 4.9 NNE 18.78 18.78 4
 SC-CD-4 Summerton 5.2 SSE 18.58 18.58 4
 SC-CR-82 Charleston 0.6 E 18.56 18.56 4
 SC-BK-37 Wando 1.1 SSW 18.47 18.47 4
 SC-CR-83 Kiawah Island 1.5 NE 18.44 18.44 4
 SC-CR-101 Charleston 2.9 ENE 18.33 18.33 4
 SC-BK-25 Moncks Corner 7.2 SW 18.23 18.23 4
 SC-CR-57 North Charleston 3.5 ESE 18.16 18.16 4
 SC-DC-41 Summerville 1.9 N 18.16 18.16 4
 SC-CR-6 Charleston 6.4 NW 18.15 18.15 4
 SC-FL-9 Effingham 2.2 W 17.95 17.95 4
 SC-CR-49 NWS Charleston SC 17.91 17.91 4
 SC-CR-42 Charleston 2.8 NE 17.87 17.87 4
 SC-BK-40 Daniel Island 0.7 SSW 17.61 17.61 4
 SC-CD-6 Manning 1.9 SSE 17.60 17.6 4
 SC-FL-12 Coward 5.1 NNW 17.51 17.51 4
 SC-GT-4 Georgetown 6.0 S 17.41 17.41 4
 SC-DC-36 Summerville 1.4 SSW 17.34 17.34 4
 SC-CR-4 Mount Pleasant 1.9 ESE 17.25 17.25 4
 SC-HR-61 Conway 6.2 E 17.19 17.19 4
 SC-CR-78 North Charleston 3.1 ESE 17.06 17.06 4


North Carolina
Station Number Station Name Daily Precip Sum in. Multi-Day Precip in. Total Precip in. # of Reports
 NC-BR-28 Calabash 1.2 NNW 21.63 21.63 4
 NC-BR-6 Sunset Beach 1.7 WNW 18.79 18.79 4
 NC-BR-1 Sunset Beach 2.9 NNE 17.67 17.67 4
 NC-BR-27 Varnamtown 1.8 ENE 16.40 16.4 2
 NC-NH-45 Kure Beach 2.4 SSW 5.82 9.4 15.22 4
 NC-BR-34 Leland 2.2 SW 14.85 14.85 4
 NC-BR-61 Southport 2.7 NNW 14.00 14 4
 NC-BR-26 Southport 5.8 WNW 13.46 13.46 4
 NC-BR-53 Southport 0.9 NE 13.42 13.42 4
 NC-BR-14 Southport 1.0 NE 13.05 13.05 4
 NC-NH-31 Bayshore 1.3 ENE 12.74 12.74 3
 NC-BR-30 Oak Island 0.7 W 12.49 12.49 4
 NC-CL-26 Tabor City 3.5 NE 12.29 12.29 4
 NC-BR-13 Southport 5.9 W 11.88 11.88 4
 NC-CM-68 Fayetteville 1.4 SW 6.00 5.63 11.63 4
 NC-NH-35 Wilmington 2.3 SE 11.56 11.56 4
 NC-BR-71 Bolivia 7.8 SW 11.48 11.48 4
 NC-NH-10 Wilmington 8.0 ENE 8.81 2.55 11.36 4
 NC-BR-45 Bolivia 7.6 SW 11.28 11.28 4
 NC-BR-2 Leland 5.7 WSW 11.01 11.01 4
 NC-NH-7 Wilmington 4.4 SSE 6.42 4.59 11.01 3
 NC-CL-17 Lake Waccamaw 3.1 SSW 11.00 11 4
 NC-NH-55 Wilmington 4.2 ESE 10.92 10.92 4
 NC-BR-69 Holden Beach 0.6 E 10.43 10.43 4
 NC-NH-46 Wilmington 6.2 SSE 10.37 10.37 4
 NC-BR-64 Varnamtown 1.3 SSW 10.22 10.22 4
 NC-PD-19 Surf City 0.8 E 10.22 10.22 4
 NC-BR-12 Winnabow 3.6 SE 10.21 10.21 4
 NC-PD-20 Topsail Beach 0.7 E 10.17 10.17 4
 NC-NH-25 Wilmington 4.1 SE 10.11 10.11 4


Below are the daily rainfall maps for the three primary days of the storm and the storm total map. It's clear that most of the state of South Carolina received more than six inches of rain from this system, with most of the coastal area of South Carolina and far southeast North Carolina picking up 12+ inches. The amount of 26.88 inches measured by the CoCoRaHS observer in Mt. Pleasant, NC over four days far exceeds the 1000-year, four day amount of 17.5 inches for Charleston. (Recurrence intervals are only published for 1000-year events or less, so the actual recurrence interval for this event was much higher). To further highlight the rarity of this rainfall, the amount of 26.88 inches is higher than the 1000-year, 30-day accumulation for Charleston. All of the superlatives used in describing this rainfall event ("historic", "unprecedented", "incredible") were right on the mark.

24-hr precipitation ending 8:00 a.m. EDT October 3.
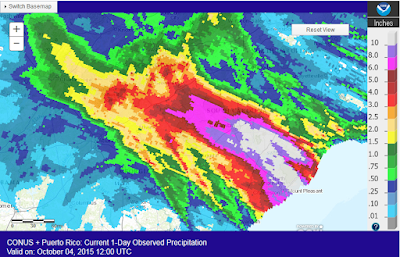
24-hr precipitation ending 8:00 a.m. EDT October 4.

24-hr precipitation ending 8:00 a.m. EDT October 5.

Storm total rainfall from 8:00 a.m. EDT October 1 to 8:00 a.m. EDT October 5, 2015.


What's a 1,000 Year Rain?

What do we mean when we say this was a "1,000 year rain"? This is called a recurrence interval, and is another way of saying that the probability of a rainfall amount equaling or exceeding a specified value has a probability of 1 in 1,000, or 0.1 percent in any year. It does not mean that the last time this amount was observed was 1,000 years ago, nor does it mean it will be another 1,000 years before it occurs again. It's just a statistical probability.

Here's a way to visualize this. Let's say we have a box filled with 1000 ping pong balls. One of those ping pong balls is red and all of the others are white. If you reach in to take a ball out of the box, there is a 0.1 percent (1 in 1,000) chance you will pick the red ball. Every time take a ball, you return it to the box. You reach in a second time and take another ball. The probability that you will select the red ball is still 0.1 percent, because you again start with 1,000 balls and only one is red. It is possible that you could select the red ball once, or twice in three draws, or never in 2,000 draws. However, the probability of the red ball in each draw is 0.1 percent. Similarly, a location could experience a 1000-year rain event this year, or again two years from now, or not for another 1,000+ years.  The recurrence intervals are determined of analysis of the precipitation history for that area or location. For example,  the 1,000-year rain for a 24 hour period in Charleston, SC is 14.80 inches, but for Phoenix, AZ the 1,000 year, 24-hour rainfall is 4.82 inches.


The sun was shining in South Carolina today, but the flooding continues on. More than a dozen dams have been breached, road damage is widespread and in many cases severe, and thousands of residents have lost their homes. As of this writing 14 people have lost their lives to the flooding. South Carolinians will be dealing with the aftermath for some time to come.

Finally, thanks to all of the CoCoRaHS observers in South Carolina and North Carolina who regularly reported rainfall during this event despite what were very challenging conditions. Your efforts are now part of the history of this storm.