Tuesday, March 25, 2014

The First Tornado Warning - Skill, Serendipity, and a Little Luck

On March 25, 1948, Air Force weather forecasters at Tinker AFB in Oklahoma issued the first ever tornado forecast (i.e. a warning).  A tornado swept through Tinker AFB during the early evening hours and caused millions of dollars of damage to aircraft, buildings, and other equipment. There were no injuries reported.

Remember, in 1948 weather forecasting was still in its infancy, especially compared to where we are today. There were no computer models or satellites, and the first tornado detected by radar didn't happen until five years later. The successful forecast of a tornado on this day was a mix of serendipity, luck, and the skill of two Air Force forecasters, Capt. Robert C. Miller and Major Ernest Fawbush.

Aircraft damaged at Tinker AFB by March 20 tornado.
Just five days earlier, on March 20, 1948, another tornado had struck Tinker AFB causing about $100million in damages, mostly to aircraft that were left out in the open. Following this storm, an official inquiry was conducted and as a result the Air Force directed that a tornado forecasting program be developed,and Fawbush and Miller were assigned the task of developing methods to forecast severe weather, especially tornadoes. The Air Force took the lead on severe weather forecasting because at the time the U.S. Weather Bureau had a policy against using the word "tornado" in a forecast. They feared panicking the public.

Fawbush and Miller began to study surface and upper air charts to look for conditions associated with severe weather.  Remember, this was well before computers - all the charts were all hand plotted and hand-analyzed. Obviously, their research couldn't have progressed very far in just a few days. However, Fawbush and Miller noticed that the weather conditions forecast for March 25th were very similar to those on March 20th. They notified the base commander General F. S. Borum. With the support and urging of Borum, they issued a severe weather and tornado forecast. That, in turn activated the new severe weather plan. Aircraft were moved to hangars, loose objects tied down, and personnel prepared to move to safe areas. By mid-afternoon afternoon of March 25th a line of storms developed southwest of Tinker AFB. At 3:00 p.m. the tornado warning was issued for the period of 3:00 p.m. to 6:00 p.m. A supercell formed just west of the base just before 6:00 p.m., and soon after the tornado crossed the air base. The resulting damages were much less than from the tornado just days earlier.

Bombers damaged during March 25, 1948 storm at Tinker AFB.

The success of that forecast spurred on continued research. There was little known about the weather patterns associated with severe storms and the two Air Force officers became pioneers in severe weather forecasting research. Fawush and Miller published a number of papers on their research, and in 1967 Miller published a technical report for the Air Force titled "Notes on Analysis and Severe-Storm Forecasting Procedures of the Air Force Global Weather Central." It was revised in 1972 and became the bible of severe weather forecasting at that time.

One of the dozens of charts depicting conditions favorable for severe weather in Miller's technical report. This is a composite chart showing a number of features, The stippled area is the extent of sever e weather occurrences. The dashed double lines located the major tracks and occurrences of tornadoes.


In July of 1950 the U.S. Weather Bureau rescinded its ban on using the word "tornado" allowing its use in public forecasts. Unfortunately, the Federal Communications Commission continued to ban its use on radio and television for the same reason as the Weather Bureau's initial ban. This continued until 1952, when meteorologist Harry Volkman broadcast the first televised tornado warning over WKY-TV (now KFOR-TV) in Oklahoma City. The warning was issued at the urging of the station manager, who had obtained the alert from the Air Weather Service and felt it was the station's responsibility to alert its viewers about impending severe weather.


For more information, see the following sources:

Tornado Forecast - 50 Years - The Historic Forecast

Maddox, Robert A.; Crisp, Charlie A. (August 1999). "The Tinker AFB Tornadoes of March 1948" (PDF). Weather and Forecasting (American Meteorological Society) 14 (4): 492–499.

Wednesday, March 19, 2014

Dusty Days in West Texas

While the eastern half of the country deals with lingering winter weather, the dry, warm conditions in the western U.S. are creating problems there.  It was a dry winter throughout the Southern Plains and southwest, especially from the Texas Panhandle west to eastern California and southern Nevada.  In much of this region precipitation over the past 90 days has ranged from less than 10 to about 50 percent of normal.

Credit: NOAA Advanced Hydrological Prediction Service
 As you may expect, drought continues to persist with the lack of rain. Much of the Texas Panhandle is depicted in Extreme to Exceptional Drought on the U.S. Drought Monitor.

U.S Drought Monitor for March 11, 2014. Red areas are in Extreme Drought, dark red in Exceptional drought.

View looking north on 19th St. in Lubbock, TX on March 18.
Photo credit: Alex Pham
Dry, dusty soils and the windy weather of spring often combine to produce a lot of blowing dust inthe Plains.  Western Texas has experienced two dust storms, or haboobs, in the past week.  One occurred last Tuesday, March 11, and another one yesterday. The  one yesterday developed as a strong cold front moved through the Panhandle.  One interesting aspect of this dust storm was that it was clearly visible on radar.  Here is a radar image at 2:56 p.m. CDT on March 18. What looks like a precipitation echo (in green and blue) is actually the dust cloud.

Radar image of Texas dust cloud on March 18, 2014.

Here is a satellite image about two hours later. The lower sun angle provides better contrast for seeing the dust clouds (outlined in yellow).  The southern dust cloud is occurring just behind the cold front boundary and originated in eastern New Mexico. The northern dust cloud developed along the leading edge of the much cooler air and a wind shift to the north. This is the huge dust cloud, or haboob, that swept across the Panhandle.Winds were regularly gusting 35 to 45 mph with some gusts exceeding 60 mph. Visibilities were reduced to 1/4 mile or less with near "brownout" conditions.


The leading edges of two dust clouds are evident in this visible satellite image.
Surface weather observation plot with the approximate position of the cold front (southern blue line) and the wind shift associated with the cold air and the wall of dust (northern blue line)

The National Weather Service in Lubbock, TX has a web page describing this event along with more photos and animations.  They also have more information on the dust storm on March 11, 2014.
The Texas Mesonet also has a page describing these two dust storms..

Monday, March 17, 2014

Ice on the Great Lakes

On March 6th ice coverage on the Great Lakes peaked at 92.2 percent, the second greatest concentration on record (records have been kept since 1973). The greatest amount recorded was 94.7 percent in the winter of 1978-1979.


As of yesterday (March 16) ice coverage was down to a little over 75 percent and should continue to decline as the weather warms.


Ice cover is one indicator of the severity of winter in the region. It takes prolonged periods of cold weather to produce the coverage and thickness of ice seen this winter.  Ice thickness exceeded 30 inches in some areas, although exact thickness is undetermined as the ice augers bottom out at 30 inches.


Although the negative impacts of ice seem readily apparent (limiting navigation and shipping), there are benefits to the ice cover on the lakes.


Once the lakes become ice covered, the potential for lake-effect snow and lake enhancement of snow diminishes. Lake-effect snows result from the development of precipitation as cold air moves over the relatively warm waters of the lakes. Once the source of "heat" and moisture is cut off so is the potential for enhanced snowfall. In the same vein, the ice cover prevents evaporation from the lakes which can help contribute to higher water levels on the lakes, important to navigation and to those communities who rely on the lakes for water supply.  The ice cover can benefit the fishing industry in the lake. Whitefish, for example, spawn in shallow water, and the ice cover protects their eggs from damaging wind and wave action. When there is little or snow cover on the ice, light penetration promotes the growth of algae, an important nutrient in the food chain. Of course, thick, stable ice on the near-shore areas is beneficial to recreational activities such as ice fishing.

How long is ice likely to remain on the lakes?  On the shallower lakes (Erie and Huron, for example) ice cover develops more rapidly and with greater concentration, but also will decline more rapidly than on the deeper lakes. On average the date of last ice is generally sometime in March in the southern Great lakes, but late April in some of the bays in the northern Great Lakes.


However, this is not an average year. In 1979, the year with the greatest ice cover, the date of last ice was mid to late May across the western half of Lake Superior.


There will be some impacts on spring and early summer weather as a result of the extensive ice cover. On a regional basis, air masses that cross the Great Lakes will be modified (cooled) more than normal and that could result in a cooler than normal spring. The delayed warming of the waters due to the ice will mean that near-shore areas subject to lake breezes are likely to find those to be very chilly breezes through early summer.

If you would like to learn more about Great lakes ice, visit the Great Lakes Ice Cover page of NOAA's Great Lakes Environmental Research Laboratory located in Ann Arbor, MI.

Tuesday, March 11, 2014

Just When You Thought It Was Safe to Go Outside...

The last several days have seen a big spring tease across much of the country. Warm air streamed into the Plains and Midwest today with highs reaching the mid 70s from Nebraska though southern Iowa and all of Missouri. St. Louis reached 80°F this afternoon. The 60s could be found as far east as Pennsylvania and the mid-Atlantic states.


Maximum temperatures ending at 7:00 p.m. CDT March 11, 2014


By the time Wednesday morning rolls around things will look and feel much different. A cold front dropped south through the central U.S. this afternoon. and a wave of low pressure is moving along that front. Showers and thunderstorms broke out this evening across Missouri and Illinois, and in the cold air further west snow was falling.

Surface map at 7:00 p.m. CDT March 11, 2014
 
Overnight the rain will change to snow and a band of 4 to 6 inches of snow or more is expected from north central Illinois east-northeast across southern Michigan and through much of New York into New England.

Probabilities for 4, 8, and 12 inches of snow, and for >+0.25 inch icing
from 7:00 p.m. CDT March 11 to 7:00 p.m. CDT March 12


The good news is that this will be followed by another warming trend by the end of the week in the central U.S. However, that will be short-lived as another cold front plunges south and returns temperatures in the eastern half of the U.S. to as much as 8 to 10 degrees below normal.

Maximum temperature departure from normal forecast for Monday, March 17.

Wednesday, March 5, 2014

Meteorological Winter is Over, but Winter Weather Is Not

The "official" three-month winter season concluded on February 28, but apparently no one bothered to inform Mother Nature. Meteorological winter runs from December 1 to the last day of February, though winter weather does begin and end well after those endpoints. The transition from winter to meteorological spring was marked only on the calendar as conditions were more like that of January in much of the country.

The most recent storm is now out to sea, but as it crossed the U.S. the last three days it left a blanket of snow and ice in its wake. On Sunday snow, sleet, and freezing rain fell across the Midwest and Ohio Valley, with upwards of 7 to 8 inches in the Missouri Ozarks. On Monday two to six inches of snow covered the ground from southeastern Ohio through northern Virginia and southern New Jersey.  Today snow fell from southern Minnesota and  Iowa across southern Wisconsin and northern Illinois.


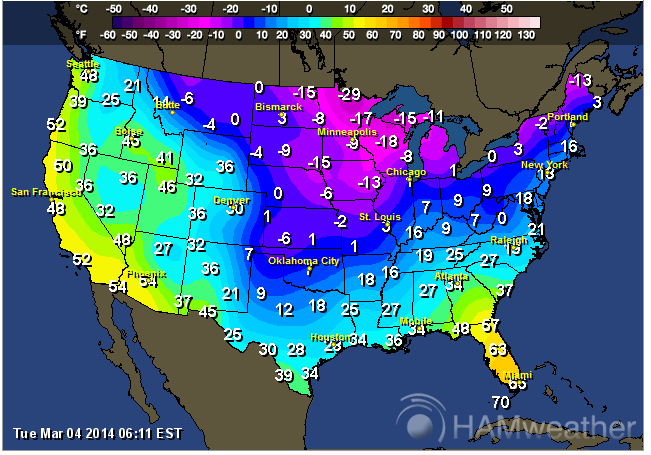
Earlier this week subzero low temperatures covered the northern Midwest and Great Lakes.


Minimum temperatures for Monday, March 3, 2014

A little over 51 percent of the lower 48 states had snow on the ground as of this morning.


The final numbers on meteorological winter are still being tallied by the National Climatic Data Center and will be available in a few days. However, we already know the this winter will be in the record books for one reason or another. Detroit, MI is experiencing one of its most severe winters on record and has piled up 83.8 inches of snow this season so far, a little less than 10 inches short of the all time record of 9.6 inches in 1880-1881. Out of the 92 days in meteorological winter, Embarrass, MN recorded 32 days with a minimum temperature of -30°F or lower  (yes, you read that correctly), a new state record for Minnesota, and through today there have been 10 days with -40°F or lower. The average temperature for the winter was -5.5°F.

Daily maximum and minimum temperatures for Embarrass, MN from December 1, 2013 to March 5, 2014

  In the east snowfall in Philadelphia at the end of February at 59.5 inches, 40.5 inches above normal (with another 3.4 inches since then). New York City snowfall totaled 57.3 inches at the end of February, 36 inches above normal.

Here is an neat animation of the cold air outbreaks over the U.S. for January through February.  This was produced by.the Computational & Information Systems Laboratory at the National Center for Atmospheric Research in Boulder, CO. The maps depict surface air temperatures, which are measured at a height of 2 meters (about 6 feet) above ground level.


 While the eastern half of the U.S. has been dealing with brutal winter conditions, the western U.S. and Alaska have been unusually warm.  Anchorage experienced its 15th warmest winter on record.  In contrast to snowfall in the Midwest and east, Anchorage snowfall was at 53.4 inches at the end of February, almost 7 inches below normal.  The Iditarod Sled Race from Anchorage to Nome (about 1,000 miles) has been hampered this year by snowless trail conditions. The lack of snow and rough trails have already knocked 11 mushers out of the race. The race began on March 2nd.