Showing posts with label Heavy rain. Show all posts

Thursday, August 13, 2026

"Stuck" Weather Pattern Produces Heavy Rain, Hot Weather

The upper level ridge that has been parked over the Central Plains for the past week has produced northwest flow aloft over the eastern Midwest. Clusters of storms forming on the periphery of the ridge in the upper Midwest have repeatedly rounded the ridge and plunged southeast through Iowa, Illinois, Indiana, Ohio and on. These often produced torrential and copious amounts of rain, a number of cases that resulted in our Big Rain Bullseye feature on the CoCoRaHS Facebook page.

500 millibar height map (about 19-20,000 feet) for the morning of August 1, 2026

The upper level ridge has been nearly stationary across the southern half of the country for at least a week, with its center wandering from the inter mountain region to the Central Plains. You can see the approximate mean location of the high in the CoCoRaHS precipitation maps for the last week.  

The daily CoCoRaHS precipitation maps for August 8-13, 2026
 

Air under the upper ridge is subsiding (sinking), which results in higher temperatures on the surface. Note the high temperatures reported over this period in the Central and Southern Plains.The sinking air also suppresses any formation of clouds, and of course showers and thunderstorms. 


Even with upper air charts and other information, it's amazing how much can be deduced from just the daily precipitation patterns. Your daily observations do matter!


Sunday, July 19, 2026

Catastropic Flooding in Texas Hill Country Second Year in a Row

It was "déjà vu all over again" when the skies opened up over the Texas Hill Country west and northwest of San Antonio this week. Daily rainfall totals from July 14 to July 17 in some locations exceeded 8 to 10 inches per day.

The same area experienced flash flooding last July 4th which resulted in at least 133 deaths. The two situations were similar in some respects, but there were significant differences. In 2025 heavy rainfall (8-10 inches) occurred in a relatively short amount of time (several hours) over a smaller localized area, resulting in extreme runoff and unprecedented rises in river levels, particularly the Gaudalupe River. It rose almost 29 feet in one hour causing massive devastation and loss of life.

The flooding this year occurred over a period of three days of heavy rain, and covered a larger area than in 2025. The long duration of the rain allowed for close monitoring and time to issue warnings and advisories.

The weather pattern that produced the environment favorable for heavy rain was a combination of a large upper level ridge of high pressure combined with low-level flow from the the Gulf into to Texas. The ridge extended north-south on an axis from the Big Bend are of Texas up the spine of the Rockies into Canada. High pressure over the Gulf of Mexico produced winds from the Gulf into Texas. The warm moist air was forced upward as it met a weak surface boundary across west-central Texas. Thunderstorm complexes developed along that boundary, tapping the continuous flow of moist air.  Thunderstorms developed repeatedly (training) over the same areas. Aloft, the steering currents at 19,000-20,000 feet were only 5 to 10 knots, meaning that thunderstorms would be moving very slowly if at all. 

Surface weather map July 16, 2026

500 millibar map July 16, 2026 showing area of very light winds at around 19,000 feet above central Texas

On July 14 (rain beginning on July 13) the highest rain totals were west of San Antonio along U.S 90. The heavy rain produced flash flooding, and many water rescues were reported. The highest CoCoRaHS observation was 8.63" at TX-MDN-64 near D'Hanis, TX. 

CoCoRaHS rainfall reports for July14, 2026

The Multi-Radar Multi-Sensor (MRMS) precipitation estimate shows a maximum of 12.17" (purple pixel in the white area).

24-hour radar estimated rainfall 8:00 a.m. July 14, 2026 


Rainfall amounts were even higher the next 24 hours, with the heaviest amounts northwest of the U.S. 90 corridor. The highest CoCoRaHS report was 12.09 inches at TX-RL-1 (Camp Wood 9.6 ESE), with radar estimates of more than 14 inches.. At this point two-day totals exceeded 14 inches (based on observations) and were very likely several inches higher.

CoCoRaHS observations the morning of July 15, 2026

Here is the MRMS 24-hour precipitation on July 15, with a core of 14+ inches of rain located about 12 miles southeast of Kickapoo Cavern State Park.

24-hour radar estimate rainfall 9:00 a.m. July 15, 2026

The highest rainfall totals occurred in the 24-hours ending on July 16, with an astounding 18.84 inches of rain at TX-KR-82 near Ingram, TX. A number of CoCoRaHS observers reported more than 10 inches of rain in Kerr County that morning. 

CoCoRaHS observation the morning of July 16, 2026

The MRMS estimate for the morning of July 16 showed two cores of heavy rain, one along U.S. 90 west of San Antonia and the other in Kerr County. The highest estimate the core in Kerr County was just a little over 13.62 inches, substantially less than actual observations from 15-18 inches. That's why actual observations - ground truth - are so critically important.

24-hour MRMS radar estimated rainfall for July 16, 2026 showing core of heavy rain over Kerr County, TX

When all was said and done, this rain event produced widespread severe flooding, significant property and road damage, and resulted in two fatalities. 72-hour estimated rainfall totals ending at 7:00 a.m. on July 16 over west central Texas revealed a huge area of 8+ inches of rain, with the highest amount estimated to be 27.63 inches in a core along U.S. 90 west of San Antonio. 

MRMS estimated rainfall fir the 72-hour period ending 7:00 a.m. July 16, 2026

Rain continued on July 16 and many locations received additional rain, but most amounts were less than an inch. Here are the top ten 96-hour amounts reported by Texas CoCoRaHS observers.

Over this period, there were 71 CoCoRaHS observers in west central Texas that reported 12 or more inches of rain, and 260 that reported 6 inches or more.

The NWS San Antonio office released a map showing the accumulation from Sunday through Thursday. Most of the rain fell July 13 through July 16 (observations July 14-July 17).


Here are the CoCoRaHS observations for that same period. 

Total accumulated rainfall July 12-17, 2026

Thanks to all of our observers who reported during the storms. No doubt many were dealing with their own localized impacts from the rain and flooding.  


Tuesday, March 19, 2019

Inundation - Disaster in Nebraska

The last three days have been some of the "quietest" days, precipitation-wise, on the CoCoRaHS maps in almost two years. It's tragically ironic that on such quiet days a slow, widespread disaster is on-going from the central Plains to the Midwest.

Last week's huge and intense winter storm got a lot of attention due to the extremely high and in some cases record wind speeds measured, record low pressure, and widespread blizzard conditions. While that was big news at the time, the aftermath of this storm turned out to be more insidious and damaging than anything that occurred while the intense low pressure system was spinning over the U.S.

On the warm side of the storm, extending from Texas through the central Plains, warm most air was pulled northward by the strong circulation around the system. Temperatures in the 60s surged through Kansas and into southern Nebraska.


While the air was mild, there was still a lot of snow on the ground, and the soil underneath it was generally frozen.

Snow depth on March 11, 2019.
Credit: NOAA NOHRSC


4-inc soil temperatures under sod for the 24-hour period ending 3/13/2019.
Credit: MRCC Regional Mesonet Program
Rain fell on the warm side of the storm, with anywhere from one to three inches across Nebraska and southern South Dakota in a two-day period.


The mild air and heavy rain resulted in rapid snow melt. With the ground frozen, the water had no where to go except into rivers and streams. The snow across Nebraska held a water equivalent from one to more than two inches, so any runoff from the rain would have that much additional water from the melting snow.

Snow Water Equivalent (SWE) on March 11, 2019.
Credit: NOAA NOHRSC
The melting was rapid and considerable as the storm lifted to the northeast.

These maps show the snow melt for the 24-hour periods ending the mornings of March 13 and March 14. Snow melt was 2 inches per day or more.

By Friday, March 16 snow had disappeared from most of eastern Nebraska and western Iowa, draining into the rivers and streams.


The sudden surge of water running off from the precipitation and melting snow along with ice on the rivers began to compound the disaster. Water flowed from smaller streams into rivers and many then into the Missouri River. While the Missouri River has been getting attention, a number of smaller rivers in Nebraska reached major flood stage.


The Missouri River went from normal to record flood stage at Nebraska City and Plattsmouth in just 48 hours.

Hydrographs for the Missouri River at Omaha, Plattsmouth, and Nebraska City.
In addition to the flooding, huge chunks of ice that recently covered the rivers caused damage to bridges, roads, and fields. Whole towns have been cut off because of flooded or washed out roads. Farmers and ranchers are suffering devastating losses as fields are flooded and damaged by water and ice. Ranchers are having a difficult time feeding or even reaching their livestock, and many lost livestock to either the blizzard conditions or the flooding. An early estimate is that this disaster could result in a $400 million loss to the Nebraska livestock sector.

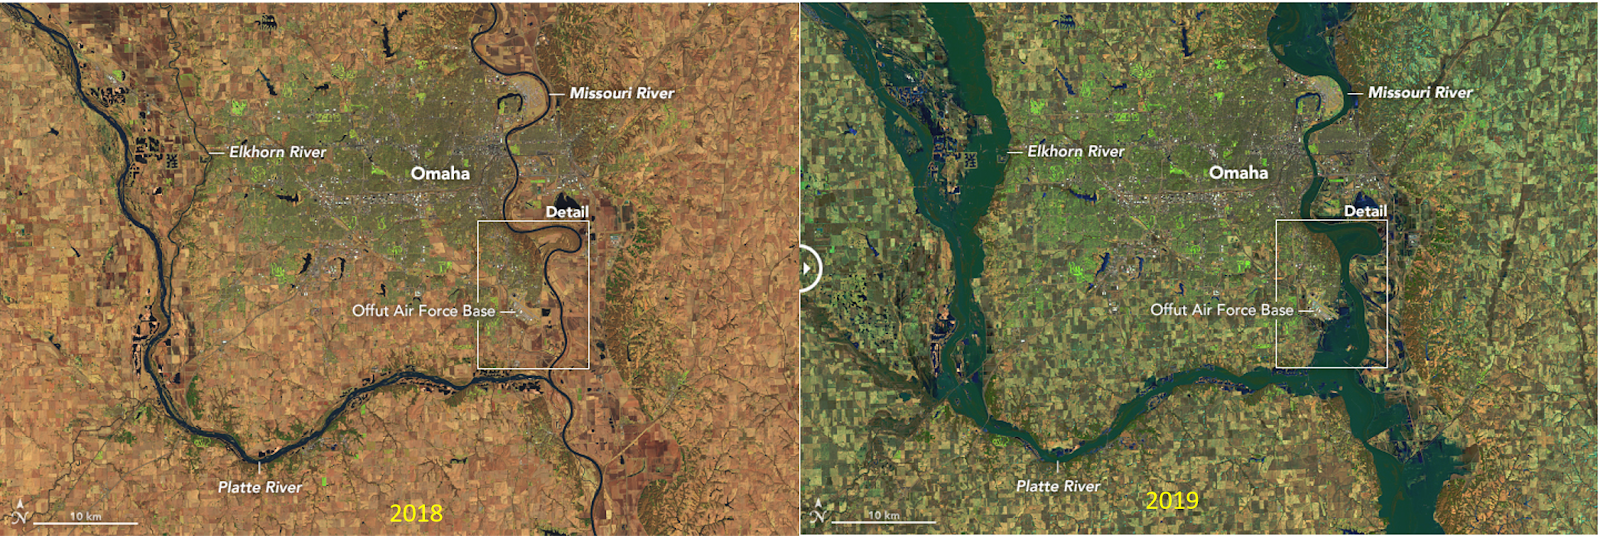
A comparison of eastern Nebraska in 2018 with no flooding (left) with 2019 (right).
Credit: NASA Earth Observatory
The National Weather Service Office in Valley, NE, west of Omaha and between the Platte and Elkhorn rivers had to be evacuated on Friday due to encroaching floodwaters from the rivers Operations were moved to Hastings, NE and forecasters will continue to work from there until floodwater recede and equipment can be checked and made operational. Almost 30 percent of Offutt Air Force Base near Omaha is flooded by the Missouri River. At it's closest extent the Air Force base is a little more than a mile from the river at normal stage.

Close-up view of the Omaha, NE area, 2018 and 2019.
Credit: NASA Earth Observatory
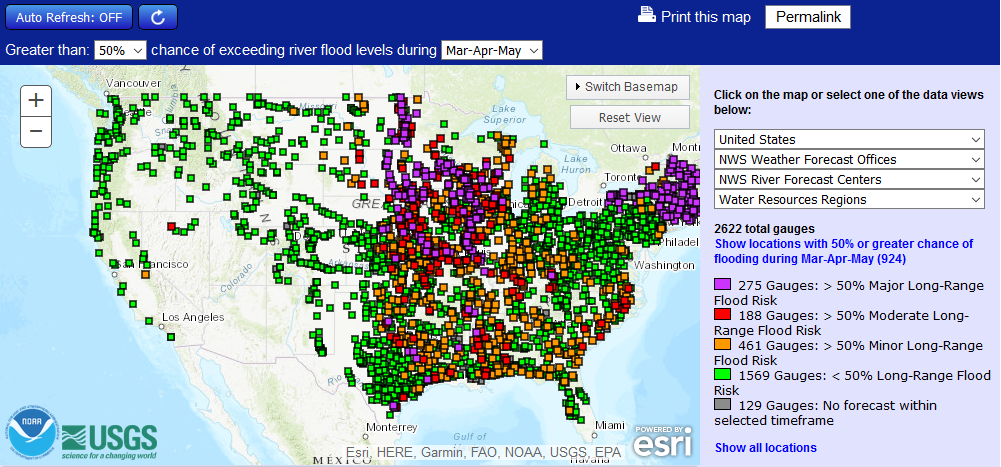
Even though river levels are slowly subsiding in Nebraska, recovery will be long and arduous. The northern Plains and central Midwest are continuing to deal with flooding conditions and it looks like flooding could be a big concern this spring in a large part of the country, particularly the central U.S. and the Northeast. This map shows where there is a greater than 50 percent chance of a flood risk from March through May.


The National Weather Service will be updating its Spring 2019 flood outlook on March 21. You can be sure there will be a lot of people closely paying attention.

Friday, August 12, 2016

Louisiana Deluge

A flooding disaster of major proportions is underway in Louisiana and is likely to get worse over the next few days.

As of early Friday morning up to 15 inches of rain had accumulated during  the preceding 24 hrs. A westward moving low pressure system that is tropical in nature had been producing torrential rains from western Mississippi through eastern and  south-central Louisiana.

24-hour precipitation valid at 7:00 a.m. CDT 8/12/2016

Amounts reported by CoCoRaHS observers topped 11 inches this morning, and a late report at 7:00 p.m. tonight reported 14.65 inches (this is likely a 36 hour total).

CoCoRaHS reports >7.00 inches for Louisiana and Mississippi 8/12/2016

The U.S. Cooperative observer in Livingston, LA reported 10.55 inches of rain this morning, and then  another 6.54 inches as of 3:00 p.m. this afternoon. The observer reported rainfall rates of 3 inches  per hour for an extended period this morning. Rainfall totals exceeding 20 inches will be common by Saturday morning across Louisiana.

The low pressure system responsible for this rain has been hanging along the Gulf coast the past several days and become somewhat more organized as it drifted east. It was located over western Mississippi this morning, and slowly drifted westward during the day today.

Surface map at 1:00 p.m. CDT 8/12/2016 showing low pressure center over western Mississippi.

Visible satellite image for Louisiana at 4:15 p.m. CDT 8/12/2016. The bulging clouds over north-central Louisiana are indicative of strong convection.
 The low is expected to eventually begin drifting to the east and northeast this weekend. The potential for additional heavy rain remains high through the weekend.

Excessive rainfall outlook for the period from 7:00 a.m. CDT Saturday 8/13 to 7:00 a.m. CDT Sunday 8/14/2016.

The 3-day Quantitative Precipitation Forecast for the period from 7:00 p.m. CDT Friday, 8/12 to 7:00 p.m. CDT Monday, 8/15/2016.

Flooding is extensive. Rivers and streams rose rapidly with the high rainfall rates. Numerous rivers in southeast Louisiana and southern Mississippi were overflowing their banks and threatening widespread flooding and most rivers are expected to reach major flooding levels.

River levels and forecasts for southwest Mississippi and southwest Louisiana.
There have been two fatalities reported as a result of the flooding, and another person was reported missing at the time of this writing. Louisiana Gov. John Bel Edwards declared a state of emergency today because of the severe flooding and additional heavy rain expected.

Update Saturday, August 13  10:30 a.m.

Here are two-day rainfall totals for Louisiana. Radar rainfall estimate of 27.47" near Brownfields, LA corresponds well with observed rainfall.

48 hour rainfall totals for stations reporting >10" in Louisiana for period ending 7:00 a.m. CDT August 13.

Thursday, October 29, 2015

A Week of Rain Reduces Drought

A week of rain associated with an upper level trough moving across the U.S. interacting with moisture remaining from Hurricane Patricia brought significant reduction in drought conditions across the southern Plains eastward into the southeastern U.S.


The Drought Monitor (l) and weekly change (r) as of October 27.

Parts of the Midwest and Ohio Valley shown in drought received one to four inches of rain after the Drought Monitor was finalized and will likely show some improvement in next week's map.


In the Caribbean, another upper level trough brought heavy rain to Puerto Rico, though the southern coastal region, where drought is in the Extreme category, missed out on much of the rain.  


Location of Navarro County
The week started with heavy rain in Texas on October 22 and October 23 as an upper level trough dropped south though the Rockies. Rain became more widespread and heavier as this trough began to tap in to the moisture from Patricia as is streamed northeast from Mexico. Eastern and southern Texas endured several days of rain which caused widespread flash flooding. The highest amounts were found  in east-central Texas where two CoCoRaHS stations reported almost two feet of rain in Navarro County between October 22 and October 26.


The highest rainfall totals for the period October 22-October 29, 2015 in Texas.

The upper trough and associated surface low slowly crawled east during the week, producing heavy rain over Louisiana, Arkansas and the Ohio Valley, and eventually into the eastern seaboard. A well defined low formed along the Texas Gulf cost on Sunday, October 25.

Surface map for 10:00 a.m. CDT October 25, 2015

 On Monday, October 26 the surface low was still well-defined on satellite over southern Louisiana.

Visible satellite image for 1:15 p.m. CDT on October 26, 2015.

Rainfall over eastern Texas, Louisiana, and Mississippi ranged from 5 to 10 inches on October 26. Two to five inches of rain fell from Mississippi east through Florida on October 27. As the upper trough over the middle of the country deepened rain shifted into the Ohio Valley and east through North Carolina with 3 to 6 inch amounts. In response to the deepening upper level trough a strong surface low developed over the Great Lakes. Heavy rain yesterday and last night was reported from the Great Lakes to New England, with 3 to 4 inches from New Jersey to Vermont. Enough cold air was pulled in behind this system to bring 1.5 to 2.0 inches of snow to parts of Minnesota and Wisconsin.

Sequence of CoCoRaHS precipitation maps for October 22 through October 29.

A large trough aloft is forecast to develop along the west coast this weekend, and that's setting the stage for more rain in the same areas that were drenched this week. This system will also bring rain to the Pacific Northwest and scattered rainfall to California.

Quantitative Precipitation Forecast for the 7-day period ending at 6:00 p.m. CDT November 5, 2015


Thursday, October 22, 2015

A Recipe for Rain, Southwest Style

Much of Texas and the Southern Plains are currently in a worsening drought situation. The latest U.S. Drought Monitor released today shows D3 (Extreme) and D4 (Exceptional) drought from central Texas east northeast into southern Arkansas and the northern three-quarters of Louisiana.


Dryness has been slowly developing since the beginning of  summer, but the drying really accelerated in the past four to six weeks.

This map shows the change in drought status from September 22 to October 20, 2015

While Texas CoCoRaHS observers may not have been seeing much but dust in their rain gauges recently, that is about to change.  A "perfect" combination of circumstances will likely bring drought-busting rain to the region the next several days, but that has a down side as well.

The first weather feature in this recipe is an upper level trough with a closed low situated over the Four Corners. On the east side of this trough strong southwest winds are directing air into central Texas.

The 500 millibar map for 7:00 a.m. CDT October 22, 2015.

The second weather feature is Hurricane Patricia, which reached Category 4 strength this afternoon with sustained winds of 130 mph. Late this afternoon Patricia was located about 250 miles off the coast of Mexico moving northwest at 12 mph. The hurricane will turn north by tomorrow morning and likely make landfall on the Mexican coast late Friday afternoon or evening. Patricia will bring abundant moisture into Mexico, moisture that will be tapped by the trough over the southwest. Hurricane Patricia is the ninth Category 4 or 5 hurricane in the eastern Pacific this year, a new record. The latest updates on Patricia can be found at the National Hurricane Center web site.

Water vapor image of Hurricane Patricia at 1:45 p.m. PDT October 22. The eye of the storm is only 12 miles in diameter.


The third ingredient to this recipe for rain is moist flow off the Gulf of Mexico.

The 850 millibar map (~5000 feet) showing winds and relative humidity for 7:00 a.m. CDT Saturday, October 24.
Light green is RH of  =>70%, dark green is =>90%

All of this is expected to come together over Texas this weekend. The National Weather Service Office in San Antonio/Austin created a nice graphic showing how all of this is expected to come together.

This graphic shows the setup for the expected rain this weekend over Texas.

Rain is most welcome, but too much rain is not. The Quantitative Precipitation Forecast (QPF) for the three-day period ending Sunday evening at 7:00 CDT shows that much of the southeastern half of Texas will get several inches of rain, with a potential for as much as 13 inches between Austin and Dallas/Ft. Worth.

Quantitative Precipitation Forecast for the 72-hour period ending Sunday, October 26 at 7:00 p.m.


Of course this forecast may change based on how the weather features finally come together, but the primary message here is there will be lots of rain in a relatively short period, primarily from now through Saturday night. That means flooding. Just six months ago drought-ending rain occurred in Texas and Oklahoma, but it also resulted in major and in some cases record flooding on many rivers in Texas. This weekend's rain will not necessarily be a repeat of last May, providing there aren't successive heavy rain events in the next month or so. By early next week the focus of heavy rain will be southern Louisiana as the system moves east

A wide swath of central Texas and south-central Oklahoma is under a flash flood watch beginning Friday morning into Sunday. Be sure to visit your local National Weather Service web site for the latest information and updates.

Watches, warnings, and advisories in effect as of 5:08 p.m. CDT