Tuesday, September 29, 2015

A Soaking Setup for the Eastern U.S.

This has been a quiet tropical storm season so far, at least as far as systems affecting the U.S. mainland. That will likely change this week, but not quite in the way you might expect.

T.S. Joaquin became 10th named storm of the season late last night, developing from a depression that formed between the Bahamas and Bermuda on Sunday. Joaquin  sits about 405 miles northeast of the Bahamas as of Tuesday evening.

Currently, a healthy cold front is crossing through the middle of the country accompanied by a large rain shield.

Surface map and radar at 8:00 p.m. EDT September 29.
Associated with this cold front is a large trough of low pressure aloft that will likely stall along the Appalachians. A low pressure wave will move northeast along the cold front, producing rain, some of it heavy, from the mid-Atlantic through New England. That cold front should be moving off the east coast Wednesday night, but then will become stationary.  An upper level ridge extending more or less west to east from northern New England into the Atlantic will block the progression of the trough over the eastern U.S., and a closed low is forecast to form over the southeastern U.S. Thursday night.


Forecast 500 millibar map for Friday, October 2 at 8:00 a.m. EDT.
Meanwhile, T.S. Joaquin is currently forecast to reach hurricane strength and may make its closest approach to the east coast, possibly off North Carolina, Sunday morning. However, the forecast track of Joaquin is uncertain given the complexity of the upper level pattern over the eastern U.S. As of this post the models have not had a good handle on the situation and there is likely to be further adjustments to its track.

Forecast positions for Tropical Storm Joaquin issued at 5:00 p.m. EDT September 29

So, we have a stalled upper level trough over the eastern U.S., a stationary front off the east coast at the surface, and an approaching tropical storm. All of this adds up to a potential significant heavy rain event along and east of the Appalachians from North Carolina into the Canadian Maritimes.

While Joaquin is not expected to make landfall, the counterclockwise circulation around the storm will be feeding moisture from the Atlantic west across the stationary front. That, combined with the stalled trough aloft tapping moisture from the Gulf of Mexico, will likely result in prolonged and heavy rain along the eastern seaboard. Forecast models are currently indicate that in excess of six inches of rain could accumulate by early next week.

A series of low pressure waves moving along the front on Wednesday and into Friday will produce the heaviest rain in the northeast and New England. Then the focus shifts to the mid-Atlantic region as moisture associated with T.S. Joaquin interacts with the stalled frontal boundary. Joaquin is expected to be eventually absorbed by the main trough aloft and will be reflected as another low pressure wave along the front. That combination will bring rain to the Northeast and New England through this weekend before high pressure takes over on Tuesday.

Quantitative Precipitation Forecasts for the three-day period ending 8:00 p.m. EDT Friday, October 2 (left), and the two-day forecast for the period ending 8:00 p.m. EDT Sunday, October 4 (right).


Quantitative Precipitation Forecast for the 7-day period ending 8:00 p.m. EDT Tuesday, October 6.

 Flood watches are already in place from the central Appalachians through New England through Wednesday. There is still is uncertainty in the how this situation will play out, so be sure to stay abreast of the latest forecasts and advisories if you are in any of the areas to be affected by this system.

Monday, September 28, 2015

The Latest NWS Forecast at Your Fingertips

There are probably hundreds of weather apps and widgets available for your smart phone or tablet. Personally, I have two radar apps (PYKL3 and Radarscope), the Blitzortung Lightning Monitor, and a few "weather forecast" apps. The forecast apps provide a forecast for your local area and have different bells and whistles, depending on the app.

One of my "go to" programs on my smart phone is an experimental widget developed by the Southern Region of the National Weather Service. This widget can be embedded in an existing web page (for example, a web page you have created for your local weather), or can be used as a stand-alone app in a smart phone or tablet. This widget is adaptive, meaning it automatically adjusts the content to the width of the screen of device using it. What I really like about this widget is the organized and compact way it serves up the weather information users want to access on a smart phone. Most National Weather Service web pages do not have mobile versions, and navigating them on a smart phone is cumbersome. (One exception to this is the Storm Prediction Center web site). I'm not a big fan of the new NWS web page design which has, to date, only been deployed in the NWS Eastern and Central Regions. The widget addresses the mobile issue and makes accessing the forecast and other information straightforward and organized.

When you first open the widget, you will get a screen with the NOAA and NWS logos and a message the the widget is loading. It will then display the opening page for whatever location you have chosen.

The opening screen of the widget. The icon to the left of the location entry box opens a Google map where you can select a location. The icon on the right will reload the forecast information for the site you have selected.

On a smart phone, all the information available is collapsed into expandable menus on the screen. Most tablets will be able to display the expanded layout without the collapsible menu.


For example, if you select Detailed Forecast, a window with four tabs is displayed, and you can select the forecast for the time period.


The Radar menu opens to a radar loop of the local NWS radar. If you select the radar map, it takes you to the full web site radar page for that office. The Satellite menu opens to a the full U.S. infrared satellite map. Tap that map and you are taken to the very nice mobile version of the Geostationary Satellite Server from which you can view a number of other satellite images.

The More menu contains links to the full web site for that NWS office and the tabular and graphical forecasts. While these are not mobile versions, you can zoom in as you would on any web page.

To add this to your smart phone or tablet, point your web browser to innovation.srh.noaa.gov/NWSwidget/.  Enter the location you want to have a forecast page for and click Go! Once the page displays, use the "Add to Home Screen" on your browser menu to have the widget readily available on your smart phone or tablet.

Remember that this is an experimental product and could be discontinued or changed at any time. In the meantime, give it a spin.

Tuesday, September 15, 2015

Some Relief on the Way for Washington, Oregon, Northern California.

A large trough of low pressure moving in from off of the Pacific will bring some much needed rain to the Pacific Northwest and some of northern California the next couple of days.


500 millibar map forecast for 5:00 a.m. PDT Wednesday, September 16
showing upper level trough moving on to the West Coast.

The rain, along with a turn to cooler weather will be most welcome by firefighters battling the many wildfires in progress in Washington, Montana, Oregon, and northern California.

Major wildfires in the U.S.

It's not in the news much, but there are also numerous wildfires in progress across the northern half of Alberta.

Major wildfires in Canada


However, it appears northern and central Alberta may see only scattered showers and miss out on any substantial widespread rainfall with the system affecting the northwestern U.S.

Rainfall amounts of the next 72 hours are expected to be from 0.75 to more than 1.50 inches along the coast of Oregon and Washington to as well as the Cascades. Rainfall is expected to be less in the Willamette Valley and in central and eastern Washington. Rainfall in northern California is likely to be heaviest in the extreme northwest portion of the state, in the higher coastal ranges, with amounts falling off to the south and east.

Quantitative Precipitation Forecast for the 72 hour period ending 5:00 p.m. PDT September 18.


Significant rain should fall on a few northern California wildfires, but the two largest and least controlled fires, the Butte and Valley fires, will likely only see lighter rain amounts. While the rain likely won't be significant in the worst fire areas,the increasing humidity and cooler weather should be beneficial in controlling the fires. The down side could be strong winds in some areas as the low pressure center moves inland..

The cooler weather marks a big change in the weather pattern in the Pacific Northwest. Seattle (SEATAC Airport) experienced 51 days of temperatures equal to or greater than 80°F, the most on record.  Portland, OR recorded 29 days with high temperatures equal to or greater than 90°F, breaking the old record of 24 set in 2009. The average number of days 90°F or above is 12.

Some more good news is that the latest 6-10 day outlook favors cooler and wetter than normal weather for these same areas.

Much further down the coast in southern California, moisture streaming ashore the remnants of Hurricane Linda produced some impressive rainfall totals this morning.

Radar image for southern California at 8:53 am PDT this morning showing rain showers
extending from near San Diego to northwest of Los Angeles.

CoCoRaHS observers in Los Angeles County, northern Orange County, and northwestern Riverside County measured more than an inch of rain this morning with 2.08 inches at CA-LA-48, Santa Monica 1.3 NNE. Lesser but still very welcome amounts occurred through much of southern California.

Monday, August 31, 2015

Cyclones Aplenty

If you're a tropical weather enthusiast the last week to ten days has been an interesting period. In the Atlantic Danny was briefly a hurricane, but fizzled out pretty quickly and fell apart last Monday in the eastern Caribbean producing heavy rain but not much else. In the wings was Tropical Storm Erika, which in the early stages appeared to be a threat to Florida. However, Erika never did make hurricane strength. It quickly fell apart as strong wind shear and the mountains of Hispaniola combined to weaken it, and the storm dissipated off the northeast coat of Cuba. Erika did bring heavy rain to the Caribbean last week and the remnant trough of low pressure continued to produce heavy rain across Florida and the southeast coast this weekend.


7-day accumulated rainfall for Puerto Rico ending the morning of 8/31/2015

24-hour precipitation for the southeastern U.S. ending the morning of 8/31/2015

A low pressure system that move off the west coast of Africa became Tropical Storm Fred Sunday,  Hurricane Fred early this morning, and was downgraded to Tropical Storm this evening. Fred is a small cyclone and likely will be moving into unfavorable upper air conditions in the next few days. Current forecasts call for it to be only a tropical depression by the end of the week.


Forecast track for Fred.

Conditions are even more interesting in the central Pacific, where three hurricanes are spinning.

NOAA GOES-West image of three hurricanes in the Pacific: Kilo (left), Ignacio (middle), and Jimena (right).


Hurricane Kilo is a Category 4 hurricane located several hundred miles east of Wake Island. Hurricane Ignacio is a Category 2 storm (it was a Category 4 storm on Sunday) located about 350 miles east of Honolulu. Hurricane Jimena is another Category 4 storm with peak sustained winds of 145 mph. Ignacio is not expected to directly threaten Hawaii, but it is producing dangerous surf conditions. This is the first time three major hurricanes (category 3 or higher) have been observed over the central Pacific at the same time.

The eye of Hurricane Jimena taken by astronaut Kimiya Yui on the International Space Station

The tropical cyclone activity in the Pacific is being supported by some very warm water. Below is an image of the Pacific sea surface temperature anomaly as of today.

Sea surface temperature anomaly on August 31. The water over which the hurricanes are located is 1.5°C to more than 2.5°C (2.7°F to 4.5°F) above normal.

Finally Tropical Depression 14-E developed in the eastern Pacific and late today was located about 700 miles south of the southern tip of Baja California. It is expected to strengthen to a tropical storm in the next 24 hours and turn to the north.

Wednesday, August 26, 2015

An Index of "Perfect Pleasant" Weather

I was reading through a recent post of Minnesota Weathertalk Blog by Mark Seeley, an Extension climatologist and meteorologist at the University of Minnesota when his mention of a "Camelot Climate Index" caught my attention.  There are a laundry list of indices used in meteorology and climatology of various types and purposes (Heat Index, Wind Chill Index, Southern Oscillation Index, lifted index, etc. etc.) but the "Camelot Climate Index" was a new one to me. Intrigued, I looked into it further.

The Camelot Climate Index attempts to identify locations with the "perfect pleasant climate", according to Jan Null, a Certified Consulting Meteorologist who developed the index. True to its name, the index was inspired by the lyrics to "Camelot" written by Alan Jay Lerner for the the 1960 musical. (Click image to see a larger version).


Null started thinking about such an index in the early 1990s, inspired by articles and rankings of the "best places to live". Most of these used the annual number of sunny days, which he felt fell short of truly defining a pleasant place to live. His idea of the ideal climate is sunny and relatively mild with few extremes in temperature, humidity or precipitation, and no snow. An interest in musical theater led to the connection with Camelot, and so he went on to develop the Camelot Climate Index using these variables.

The index is calculated using the 1981-2010 monthly average values of maximum and minimum temperature, average afternoon relative humidity, the number of days above 90 and below 32, precipitation, and sunshine data. He calculated weighting factors for the variables, and then subtracted the weighting values from 100 (100 represents "perfect" weather).

The resulting map of values indicates that the weather best meeting the criteria Null established extends from the Desert Southwest to and up the west coast. The highest index values (and thus the "perfect pleasant climate", as Null puts it) is along the California coast.


A complete description of the values and calculations used can be found on his Camelot Climate Index web page.

Null is the first to admit that the Camelot Climate Index is completely subjective because it's based on his perception of what makes the perfect climate - yours and mine may be different. Some time in the future he would like to construct a "variable" index that might be compiled for different perceptions of an "ideal climate".

We have been enjoying some beautiful (dare I say perfect?) late summer weather here in much of the Midwest this week. Skies have been mostly sunny, daytime highs in the 70s, overnight lows in the 50s, and no rain. While that's great weather for a week or three, to me at least, I don't think I could deal with it year round. I enjoy the four distinct seasons and the weather they produce. So while San Diego might be a great place to visit, I wouldn't want to live there. I have to have my snow and thunderstorms. Heck, even the song "Camelot" mentions snow.

Tuesday, August 18, 2015

Stirrings in the Subtropical Atlantic

It has been a quiet tropical storm season so far this year. As of today there have been only three named storms: T.S. Ana from May 8-11, T.S. Bill from June 16-20, and T.S. Claudette from July 13-14.  This morning Tropical Depression #4 was identified by the National Hurricane Center, and this afternoon it was upgraded to Tropical Storm Danny.

The first three named storms of 2015.

While this season may seem quiet, it is actually running close to normal this year so far. Normally by this date in August there are only three to perhaps four named storms, with one of those hurricane. None of the three storm this year attained hurricane strength.

Climatology of tropical cyclones in the Atlantic Basin. The green lines intersect at about today's date.

NOAA's outlook for the 2015 hurricane season, updated on August 6, maintained its earlier outlook for a below average tropical season. The outlook estimates a 90 percent probability for the following:

    6-10 named storms, which includes the three named storms to date
    1-4 hurricanes
    0-1 major hurricanes
   
The climatological average for a season is 12 named storms, 6 hurricanes, and 3 major hurricanes.

The outlook for a below-average season is the state of the current oceanic and atmospheric conditions and predicted conditions through the fall. These include the strengthening El Niño, which tends to produce strong vertical wind shear and enhanced sinking motion across the tropical Atlantic and Caribbean Sea, both kryptonite to tropical storm development, and cooler than average sea-surface temperatures in the tropical Atlantic.

There were only eight named storms in 2014, and then you have to back to 1997 to find a season with that few storms. The period from 1991 through 1994 were seasons with 8, 7, 8, and 7 storms respectively.  Residents of the Atlantic and Gulf coasts should not get complacent and drawn in to a false sense of security, however. It only takes one storm to cause devastation. Hurricane Andrew in August of 1992 was only one of seven storms that year, and was, at the time of its occurrence, the costliest hurricane in U.S. history. It is now second only to Katrina in 2005 (adjusted to 2010 dollars).

So what is the normal character of the season at this time? The season rapidly spins up to a peak about September 10, with a small secondary peak in mid October.


The typical origins and paths of tropical cyclones in August and September are shown below.

The origins and prevailing tracks of tropical cylones in the Atlantic Basin in August (top) and September (bottom).


Tropical cyclones can originate just about anywhere in the basin from August 21-31, with a band from the west coast of Africa through the subtropical Atlantic to the Caribbean most favored.

Locations of tropical cyclone formation for the period from August 21-31. Data for the Atlantic is from 1851-2009.
Source: National Hurricane Center
 

These maps and much more information can be found on the National Hurricane Center's Tropical Cyclone Climatology web page.

Tropical Storm Danny is currently expected to attain hurricane strength Thursday afternoon. It will several days before any threat to land can be determined. In the meantime you can follow the National Hurricane Center's outlooks and advisories on the NHC website.

Advisory on Tropical Storm Danny issued at 5:00 p.m. EDT August 18.

Tuesday, August 4, 2015

Tampa and West Central Florida Slosh Through Two Weeks of Heavy Rain

It has been a very quiet tropical season in the Atlantic Basin. There have been only three named systems in the Atlantic so far this season (Ana, Bill, Claudette), and none of these tropical storms have directly affected Florida. Typically the west-central coast of Florida gets about 60 percent of its annual average rainfall in the months of June through September, coinciding with the first half of the tropical storm season.

Tampa flooding on August 2.
Credit: John Kassel via Facebook
In the past two weeks west-central Florida has received from 10 to 24 inches of rain resulting in persistent flooding and a general mess for residents. The Tampa Bay areas has been been the bulls-eye for the heavy rain, with Pasco, Pinellas, and Hillsborough Counties recording the highest rainfall totals.


14-day accumulated precipitation for Florida.
Source: NWS Advanced Hydrologic Prediction Service

The rain has resulted in persistent and widespread flooding. The flooding has closed numerous streets and roads, overloaded wastewater pumping stations, and forced the suspension of trash collection. In Pasco County the Anclote River threatened 5,700 homes with flooding, with more than 320 homes evacuated.

Flooding on August 4 in the Seven Springs area of Pasco County.
Credit: Pasco County Sheriff

The river crested at 25.25 feet at 11:45 a.m. EDT this morning and is expected to steadily fall to below flood stage on Friday. The record crest for the Anclote is 27.7 feet set on August 8, 1945. The last time the river was this high was in June 2012 when it reached a crest of 26.81 feet.


The reason for the rain was a frontal system which stalled over central Florida and a series of low pressure waves along that front. The cold front pushed into northern Florida on July 24. It stalled over central Florida on July 25, and that's when the skies opened up. Two to seven inches of rain fell on the Tampa Bay area in the 24 hour period ending on July 25, and it has rained every day since.

Surface map for 8:00 p.m. EDT July 25, 2015

The chart below plots the last 14 days of rainfall for CoCoRaHS Stations FL-HB-55 (Tampa 5.0 NNE),FL-PS-4 (Port Richey 2.0 NNE), and FL-PN-41 (Tarpon Springs 5.6 E), the highest totals for the period in Hillborough, Pasco, and Pinellas Counties respectively. Though the rainfall totals for the stations for the two-week period are similar, the three stations generally had wide day-to-day differences in rainfall. Note that there is no observation available for FL-PN-41 for August 4 as of this post, but other CoCoRaHS observers in the vicinity had another two to three inches of rain this morning.


Although July 25 marked the start of the very heavy rain, rain has fallen in this area every day since the middle of July. As of today FL-HB-55 has had 21 consecutive days of measurable rain, FL-PN-41 21 days, and FL-PS-4 23 days. The average July precipitation for this area is about 7.90" and the average August precipitation 8.80".  Average annual precipitation for this area is about 52 inches.

The 11.84 inches measured in July at the Tampa International Airport was the 8th highest July total since records began in 1939. The record is 20.59 inches in 1960.   However, it was on the low end of totals reported by CoCoRaHS observers in the areas. A few Hillsborough County stations reported more than 15 inches for July. However in Pasco County FL-PS-4 tallied 20.90 inches for July, and in Pinellas County FL-PN-41 measured 26.90 inches.

The Tampa Bay area got a break today, as most rain was north and east of the area as the low pressure system lifted northeast. It was located on the South Carolina coast today. More than four inches of rain was reported  along the South Carolina and North Carolina coasts this morning.

24-hour precipitation ending the morning of August 4.
  The low is expected to continue into the Atlantic before merging with another weather system, but not before more rain and winds affect the coastal areas.

Wednesday, July 29, 2015

A Wild Two Days in the North

It was an interesting and exciting start to the week in the northern Rockies, northern Plains, and southern Manitoba. Snow, a long-lived tornado-producing storm, and hurricane force wind gusts were the result of an unusually strong low pressure system that developed over the northern Rockies on Monday and then rapidly intensified as it moved northeast into Manitoba. This system was fed by very warm, humid air to the southeast of the low and cold, dry air to the northwest, and was associated with a strong closed upper level low.

500 millibar map Tuesday, July 28, at 7:00 a.m. showing closed low over northern Montana and southern Manitoba.
Surface map for July 27 at 10:00 p.m. CDT

On Monday there was snow in Wyoming, Montana, and Idaho. There were several inches of snow above 8,000 feet elevation, including snow at ski areas in Jackson Hole, WY and in Glacier National Park in northwestern Montana. Flurries were even reported in Missoula. Temperatures on Sunday in western Montana and northwestern Wyoming were in the mid 80s, but on Monday daytime high temperatures were only in the low to mid 50s.

Surface temperatures at 5:00 p.m. MDT on July 27.


Strong thunderstorms developed northeast of the low pressure system late Monday, and one particularly strong storm developed over southwestern Manitoba during the early evening. This thunderstorm put down a tornado southwest of Melita, Manitoba around 8:30 p.m. CDT.

Radar image showing strong thunderstorm over southwestern Manitoba at 9:41 p.m. July 27. A hook echo is evident on the south end of the storm.


Radar base velocity image for 9:56 p.m. CDT on July 27. The white oval marks where rotation is indicated. Green colors are movement toward the radar. Red colors are movement away from the radar.

The tornado moved north-northeast over the next two and a half to three hours. At 10:55 p.m. CDT the storm was observed near Virden, and it's possible it lasted for a time after that but was not observed because of darkness.


Map showing approximate locations and times of the observed tornado.

It's possible that the thunderstorm produced multiple tornadoes rather than one very long-track tornado, but there was no doubt this was a monster storm. At one time the storm was estimated to be one kilometer (.62 mile) wide. Fortunately the tornado missed populated areas and there were no known serious injuries. The tornado did damage farm buildings, trees, power lines, and actually ripped pieces of asphalt from a highway. Meteorologists from Environment Canada have been investigating the damage and preliminarily assigned it a high EF-2 rating on the Enhanced Fujita scale. The damage survey has been hampered by the fact that the tornado did not hit many structures and spent much of its time over open fields. Of course, for the residents of the area that's a good thing.

On Tuesday the strong low was moving through Manitoba, and the intensifying low generated strong winds across southern Manitoba and North Dakota. Winds gusted to 70 mph and more at several locations in North Dakota, with the highest wind gusts of 76 mph reported at Garrison in central North Dakota and Alkabo in the northwestern corner of the state. Wind gusts in excess of 55 mph were common in western and central parts of the state. In eastern North Dakota winds gusted from 40 to 50 mph with the highest gust 59 at Devil's Lake and McHenry.


Surface map for Tuesday, July 28, 4:00 p.m CDT
Large-scale strong low pressure systems such as this are rare during the summer. This type of system typically occurs in the late fall to early spring, and often is associated with snow and blizzard conditions in the winter.

Thursday, July 23, 2015

Record Rain in Southern California Just a Drop in the Bucket

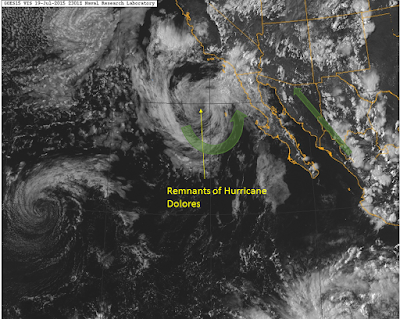
At the start of this week there was some unusual weather in southern California - heavy rain. A low pressure system off the coast that used to be Hurricane Dolores and the southwestern monsoon flow combined to produce showers and thunderstorms from western Arizona west through southern California.

Visible satellite image of the southwestern U.S. at 4:00 p.m. PDT July 19. Green arrows show direction of winds.

Dolores attained hurricane status on July 13 off the central Mexican coast, then moved north northeast parallel to Baja California. It was downgraded to a tropical storm on Friday, July 17. By Sunday, July 19 it had weakened even further and was a post-tropical cyclone.  The circulation was well-defined, and the low pumped moisture from the Pacific into northern Mexico and southern California. This augmented the moist flow of air associated with the southwestern monsoon, and the result was record-breaking July rainfall for many locations in southern California. San Diego has received 1.71 inches of rain in July so far which breaks the old 150 year-old record of 1.29 inches set in 1865.

Some rainfall records in southern California. From NWS San Diego.

One of our CoCoRaHS observers in San Bernadino County received 3.75 inches of rain over two days (by far the highest amount reported so far that I've seen), with a total for the month of 3.83 inches. Seven observers have measured more than 3.00 inches this month, and another several dozen observers have measured an inch of more. Not bad for an area where the normal July rainfall is just a few hundredths of an inch.  Downtown Los Angeles has received 0.38 inches of rain this month. The normal is 0.01 inch.

24-hour CoCoRaHS totals the morning of July 20.

Total rainfall for the period from ~7:00 a.m. PDT on July 18 to &:00 a.m. PDT on July 20 in southern California.

As you might expect, that amount of rain caused problems. Many roads were flooded and washed out. Power was knocked out in some communities. A bridge on Interstate 10 between Coachella, CA and the Arizona state line washed out on the eastbound side and was compromised on the westbound side by flash flooding. The I-10 eastbound lanes are closed indefinitely until the bridge is repaired. The westbound lanes were opened again on Tuesday (July 21). About 27,000 vehicles normal travel this section of I-10 every day.

Firefighters stabilize a pickup truck that drove into washed out I-10 bridge. The driver was rescued.
Photo credit: CalFire Riverside


Map showing location of damaged bridge on I-10 and section closed (yellow).

On Sunday (July 19) the baseball game between the San Diego Padres and the Colorado Rockies in San Diego was first in a rain delay (6th time in history) and then eventually called off. It was only the second time in Petco Park history (since 2004) that a game has been rained out. The last rain-out occurred in 2006.

The rain did little to relieve drought conditions. The rain, while significant, is just a very small drop in a very large bucket. With evaporation rates on the order of 0.20 to 0.25 inch per day what didn't run off will soon be back in the atmosphere. The water balance chart from CoCoRaHS station CA-RV-21 in Riverside, CA shows just how little dent the recent rain made in the water deficit since May 1.


Drought conditions over the western U.S. and particularly California remain unchanged. They are likely to remain unchanged until the wet season begins in the winter, and then only if precipitation occurs regularly and is well above normal.

Wednesday, July 8, 2015

Improving Communication of the NWS Forecast

If you have frequented your local National Weather Service office's web site for your local point forecast through the "point and click" map interface you are familiar with the "forecast-at-a-glance" across the top of the page accompanied by icons depicting the type of weather expected. Effective July 7 the NWS instituted changes to these icons to make them even more representative of the weather expected. Changes include new graphic images for a variety of expected weather conditions. the ability to depict forecast for six-hour intervals, and colored "hazard boxes" to highlight watches, warnings, and advisories in the forecast period.

The icons weren't changed just for the sake of changing them. The changes were made based on research conducted by the National Center for Atmospheric Research (NCAR) in Boulder, CO, and by comments collected from users last year. Researchers surveyed people from across the country and found that most had been frequent and long-time users of the map interface. Researchers tested the former icons and the newly designed icons and presentation format. They found that the colored boxes drew attention to watches and warnings, and users were more aware of hazardous weather threats with the addition of start and end times to the hazard information. If you would like to read more about this research and evaluation see "Improving effectiveness of weather risk communication on the NWS point-and-click web page".

This is the sample forecast presentation that the NWS has on its page explaining the change in format. Note that in periods where the probability of precipitation is increasing or decreasing that change is shown on the icon. A yellow hazard box highlights the period of a severe thunderstorm watch, and also includes the icon for the first period of the forecast. The severe thunderstorm watch is also highlighted in the 12-hour forecasts in the background.  The icon for Saturday depicts the expected weather for both the early and later part of the day.


If there are multiple watches and or warnings, these can be displayed as well. In the example below the forecast for Muskogee, OK for Wednesday depicts a Flash Flood Watch (yellow) into the evening (7:00 p.m. in this case) and a Flash Flood Warning (red) until 1:30 p.m. This information can be seen by clicking the "i" button at the top or on the multiple hazards box.

In the example below, a Red Flag Warning (favorable conditions for wildfire) is in effect for Jordan Valley, OR.


The point and click forecast pages on the NWS web sites receive on average 2 million hits per day, and during major severe weather events that number is substantially higher. If only, say, five percent of those viewing the page have a better understanding of the forecast and weather risk, that's tens of thousands of people who are more aware.

The NWS has a web page that lists all the weather conditions/forecasts and their associated icons (more than three dozen of them). They will continue to accept feedback about the new forecast-at-a-glance presentation and icons, and an email address to do so is provided on the page.