Tuesday, February 18, 2014

A Brief Break in Winter Weather

Forecast max temperatures for February 20.
For almost a week the forecasts for the central and eastern U.S. have been advertising a Februarythaw. The thaw is underway and will continue through the end of the week. As much as the warmer weather is welcome, it will have a down side. The quick warm-up, a deep blanket of snow on the ground, and expected rainfall up to an inch or more will likely cause flooding issues in snow-covered areas of the Midwest and east.

Snow cover on February 18, 2014

A storm system that has moved into the Pacific Northwest bringing rain to coastal areas and snow to the Cascade will move out of the Rockies toward the central U.S. by Thursday. This system will tap into moisture flowing northward from the Gulf of Mexico triggering showers and thunderstorms from the southern Plains into the Ohio Valley. In the cold air north of the low center's path heavy snow will likely fall across the northern Midwest and Great Lakes.  Moisture streaming over the cold air in northern New England may result in some freezing rain.


Surface map forecast for Thursday, February 20.

A broad area from the Gulf Coast to the  southern Great Lakes is in a Slight risk for severe thunderstorms on Thursday. The northern third of this area just picked up 4 to 8 inches of snow yesterday from the last system to move through.


Convective outlook for February 20 issued on February 18


Those of you who are weary of winter will have to hunker down a bit longer.  The latest 6 to 10 -day outlook from the Climate Prediction Center indicates a high probability that temperatures will be below normal through the end of the month.


After a day or two with highs in the 40s and 50s, temperatures will return to normal and then below normal through next week for much of the eastern two-thirds of the country.

Maximum temperature forecast for Wednesday, February 26.


The good news is that the days are getting longer and the sun is getting higher in the sky.  Spring will be here before you know it.

Friday, February 7, 2014

Winter Storm Leaves Huge Footprint

Surface map for 7:00 a.m. February 5, 2014
The winter storm that swept through the central and eastern U.S. the start of this week left its mark on an area stretching from the southern Plains to northern New England. The storm left a broad swath of 4 or more inches of snow from the Texas panhandle to Maine. Snow amounts reached 12 inches at locations in eastern Kansas, Pennsylvania, New York, New Jersey, Connecticut, and Massachusetts.


South of the main band of snow freezing rain coated power lines, trees, and roads with ice in parts of Kentucky, West Virginia, Virginia, Maryland and DC, Pennsylvania, and New Jersey. Officials estimated that at least one million customers were without power on Wednesday as a result of the storm. It could take up to a week to restore power in some areas.

In the wake of this storm another Arctic air mass plunged south all the way into the Gulf of Mexico and spilled west over the Continental Divide .

Temperatures at 6:00 a.m. CST February 6

Light snow and sleet fell in the Houston area yesterday and this morning freezing temperatures were found along the Gulf coast.

Minimum temperatures as of 6:00 a.m. CST February 7.

More than 67 percent of the continental U.S. is now covered with snow, almost 20 percent higher than just a week ago.


Tuesday, February 4, 2014

"The sky is falling! The sky is falling!"

This has been a rough winter for much of the central and eastern U.S. There has been persistent cold and storm after storm.  It has been a few years since this much of the country has experienced a winter of this magnitude.

There have been a couple of occasions this winter when unofficial  forecasts (i.e. not by the National Weather Service) for snow were released and spread like wildfire through social media and in some cases conventional media. One recent example is for the storm that is currently affecting the central and eastern portions of the country. Last Friday, January 31, a forecast of up to 2 feet of snow for Iowa, northern Illinois, and southern Wisconsin for today received more than a little attention in social media.

A forecast through Wednesday, February 5 issued on January 31.

So what was this all about?  This forecast for five days out was someone's interpretation of the results from some computer model. I don't know who produced this forecast nor what they used to produce it.   The bottom line is that the capability to accurately forecast snow amounts and location this far in advance just doesn't exist.

The atmosphere is very complex, as are the computer models that simulate the atmosphere. The accuracy of these simulations depends a lot on the initial conditions the model start with. These initial conditions are usually weather observations, but the density of weather observations varies and assumptions or estimations  have to be made where there is sparse data. If these assumptions are off or incorrect then the performance of the model suffers, and the result (the forecast) gets worse the farther out in time you go.  This is just one aspect of forecasting snow. Snow amounts are tough to forecast. We tend to think of snow as a generally uniform blanket, but snow amounts can vary in much the same way rainfall varies in the spring. That's the reason snowfall forecasts are a range of amounts, for example, "6 to 10 inches". Snow storms can have convective elements, i.e. "thundersnow" that produce intense snowfall rates over relatively small area of the storm's footprint. Bands of snow may sit over the same area producing higher amounts of snow than areas around them.

The Chicago office of the National Weather Service put together an excellent video describing the complexities in forecasting snowfall amounts, including the uncertainty in the computer models and the accuracy of snowfall forecasts made from one to six days out. It's well worth the time to watch.


Wednesday, January 29, 2014

Deep Chill in the Deep South

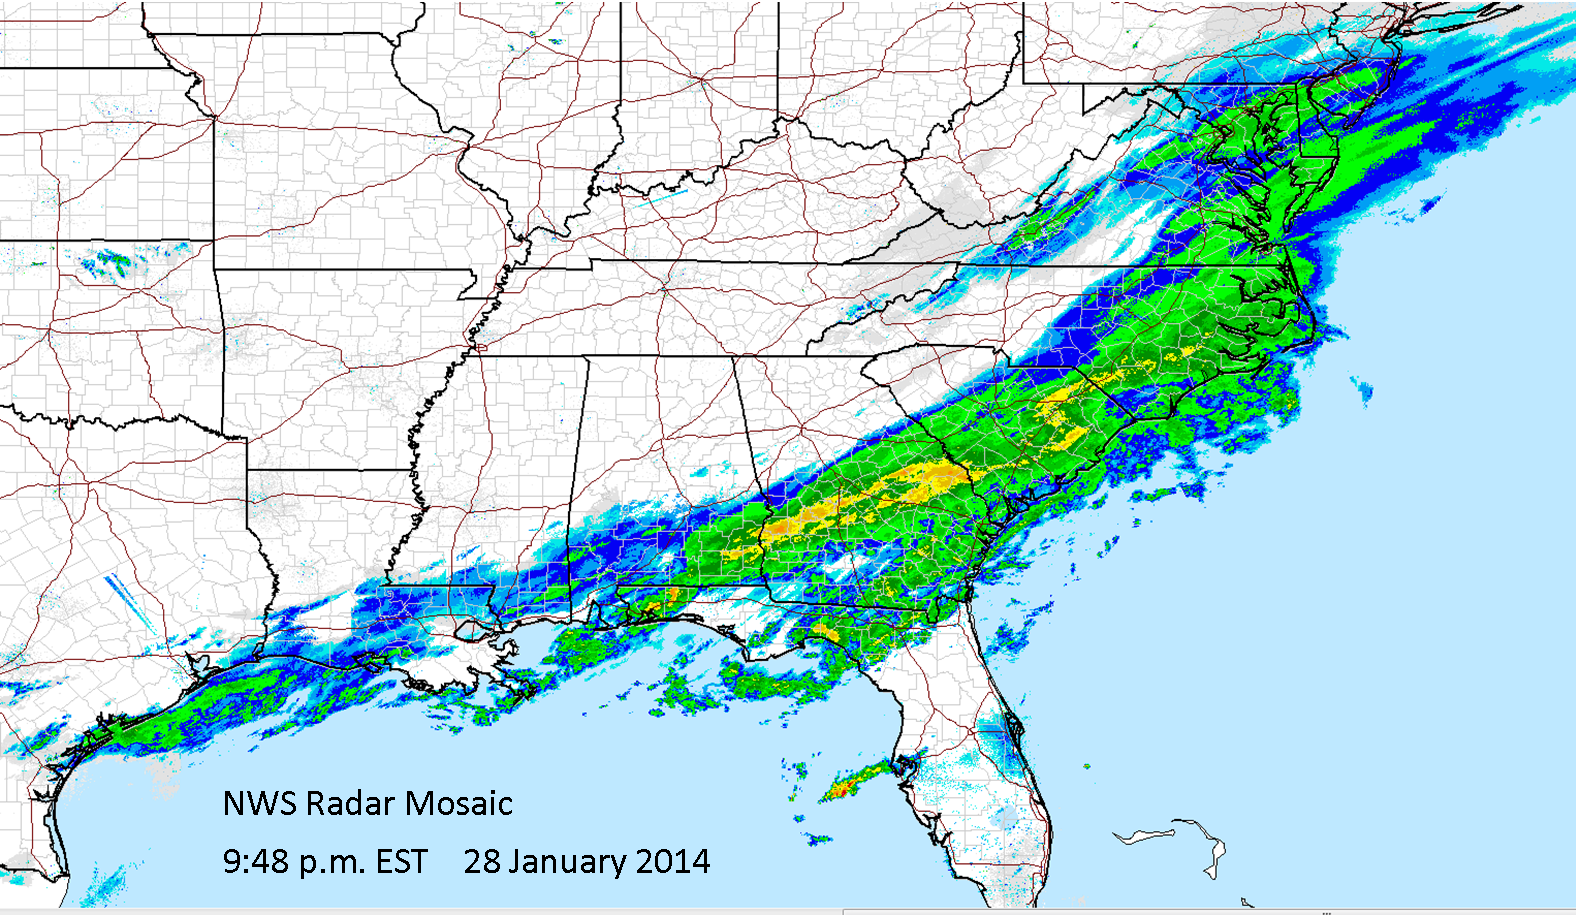
The most recent surge of Arctic not only brought the coldest air of the season but also was the most expansive. After bringing subzero readings to much of the central U.S. the cold air mass knifed into the deep south. The cold front slowed to a crawl as it reached the Gulf Coast states, and warm mosit air riding up over the cold air produced a band of precipitation from Louisianna to Virginia.


Last night the leading edge of the cold air stretched from the middle of the Gulf of Mexico to across northern Florida, and precipitation had beren occurring all day along and behind the front. Wintry precipitation, from freezng rain to sleet to snow, fell from Louisianna into Alabama, Georgia, the Carolinas, and Virginia.

Surface map for 7:00 p.m. EST January 28, 2014


The cold front has advanced into southern Florida, and a band of precipitation continues to affect areas on the cold side of the boundary.


Surface map at 7:00 a.m. EST and radar image at 10:38 a.m. EST January 29, 2014
 
This morning Winter Storm Warnings extended from the Florida Panhandle through Georgia and into southern South Carolina.

Watches, warnings, and advisories as of 10:06 a.m. EST

 Here's a forecast for Tallahassee, Florida you won't see very often.


Snowfall amounts as of 7:00 a.m. EST this morning were as high as 4 to 6 inches in eastern North Carolina to southeast Virginia and from 1 to 3 inches from east-central Alabama across northern Georgia.  Many CoCoRaHS observers in the south got their first experience measuring snow this morning. In North Carolina 5.3 inches of snow was reported by station NC-DR-10 Kill Devil Hills 0.9 WNW on the Outer Banks! Six inches of snow was reported by the observer at NC-NS-18, Elm City 6.3 NW in Nash County.


Traffic cam from Atlanta on the morning of January 29, 2014
Snow wasn't the only problem. Freezing rain and sleet were also mixed in, and in a part of the country where the need for snow removal and ice treatment is rare the wintry precipitation was disastrous. In the Atlanta area snow and ice brought traffic on area roads and Interstates to a paralyzing gridlock. Vehicles moved only a mile in 6 to 10 hours. Many people abandoned their cars to find shelter from the weather, only to make matters worse.  Traffic in the Atlanta area is still a mess this morning and it is likely to be days before things return to normal. Temperatures will climb above freezing tomorrow and the rest of the week, but sunshine won't clear the vehicles from the roads.


Wednesday, January 22, 2014

The Clippers Keep On Comin'

Map showing general path of an Alberta Clipper
Credit:  NOAA
A series of fast-moving low pressure systems have brought surges of bone-chilling Arctic air and mostly light snow to the Midwest and east the past week to ten days. These storms, known as "Alberta Clippers", generally develop on the east side of the Canadian Rockies. Typically there is an upper level trough over the eastern U.S. and these storms ride the jet stream southeastward on the back side of the trough.  They are speedy systems and usually are not very intense. Their fast movement also doesn't allow time for a large amount of moisture to be drawn in to the system and results in generally light precipitation. However, much colder and windy weather typically follow these systems.  The strong, cold winds often result in heavy lake-effect snow in the lee of the Great Lakes. Occasionally a clipper will intensify when it reaches the mid-Atlantic Coast and becomes a much stronger storm, such as the one the affected the eastern U.S. last night and today.

48-hour snowfall ending the morning of January 22, 2014.

There have been several of these Alberta Clippers over the past week or more.  The upper level disturbances produce these clippers have been favored by the strong, persistent upper level trough over the eastern U.S. coupled with the ridge in the eastern Pacific.

Here is the 500 millibar map (~18,000 ft) from this morning with three "short waves" marked. Below that is the surface weather map from this afternoon at 1:00 p.m. EST.  The disturbance just off the east coast is associated with the storm that left up to a foot of snow in New York and New Jersey today. The wave over the northern U.S. is associated with the low and cold front moving through the Northern Plains and Midwest today. Further northwest there is yet another wave moving over the top of the ridge that could produce another clipper in a couple of days.


Surface map for 1:00 p.m. EST 1/22/2014

 This animation of the 12:noon CST weather map for the past ten days shows the progression of the Alberta Clippers across the eastern half of the U.S. along the same general path.

Surface weather maps for 12:00 CST January 12-22, 2014

The path of the clippers is also seen in the snowfall pattern over the eastern U.S. the past ten days.


It appears the current upper air pattern will remain in place for the next week to 10 days, so winter weather will continue to affect the Northern Plains, Midwest and east.

Thursday, January 16, 2014

"It Never Rains in Southern California"

Residents and CoCoRaHS observers throughout California (and not just southern California) may be humming this Albert Hammond song from 1972 with complete justification.  The western U.S. has been suffering through drought conditions for much of the last year, but conditions have worsened in the past three months. Currently 90 percent of California is in at least severe drought, and 63 percent is in extreme drought.


Winter is usually the wet season in California as storms roll in off of the Pacific and produce rain along the coast and snow in the Sierra Nevada. The snow is particularly important for California and the west. Snowmelt in the spring and through the early part of summer is counted on to fill reservoirs that supply water to communities and irrigation for agriculture. The winter snowpack in the northern and central Sierra provides about a third of California's water supply.

Satellite images of the Sierra Nevada range
in January 2013 (left) and January 2014 (right).
Credit: NOAA Environmental Visualization Laboratory
The water equivalent in the snowpack in the Sierra is only 19 percent of normal and that is raising concern for the spring and summer. When snow survey teams headed out on the first survey at the beginning of January found more bare ground than snow in some areas. The current level is the lowest on record along with January 2012.


This series of charts shows the water content of the snowpack as a percent of of the April 1 average. Note that this season to date (pink line) is at or below the driest season on record (1976-1977)
 
Source: California Department of Water Resources
What has happened to the storms that normally bring rain and snow to California? They have been kept at bay by a persistent ridge of high pressure over the eastern Pacific and western U.S.  The corresponding downstream trough over the central and eastern U.S. has been responsible for the cold and snow so far this winter.

Here is the climatological normal 500 millibar level (about 18,000 feet) pattern for the period from December 1 to January 15. The upper level winds flow parallel to the contours on the map Note how in the contours are fairly flat in the western U.S., which means winds tend to steer Pacific storms into the region.


Here is the mean 500 millibar pattern for the last 45 days. Notice the ridging of the contours in the eastern Pacific. Winds steer Pacific storms northeastward over the ridge into Alaska and western Canada, deflecting them away from the west coast.


It is still early in the snow season, and a few large, wet storms in through March could help the situation. However, the U.S. Drought Outlook indicates that drought conditions will persist through the end of April. In addition to water supply problems the extreme drought conditions will mean a volatile wildfire season.

Friday, January 10, 2014

Buckets of Rain in Florida

When I see the CoCoRaHS U.S. map apparently filled with only blue dots my first thought is that there is an observation with a misplaced decimal, skewing the map scale to the high side. That was my thought this morning when I pulled up the web site. I went to check the observations to see where the high value was, and it was quickly obvious that this wasn't an error.


Heavy rain fell yesterday afternoon through last night along the southeast coast of Florida in Palm Beach County. The heaviest rainfall reported was an astounding 22.21 inches in Hypoluxo. The largest amount from a CoCoRaHS observer was 14.79 inches near Lantana. That amount is low, according to the observer, because the gauge was already full when he emptied it just after midnight (the gauge holds about 11 inches).

 
CoCoRaHS reports for Palm Beach County, FL on January 10.


CoCoRaHS observers also reported 10+ inch amounts from Martin and St. Lucie counties. Quite a few observers reported 5 inches or more for this event .Here are some of the highest amounts reported to the National Weather Service so far from Palm Beach County.

...PALM BEACH COUNTY...
   1 WSW HYPOLUXO       22.21   800 AM  1/10  MESONET
   1 SW PALM BEACH      16.03   800 AM  1/10  MESONET
   LANTANA              15.04   800 AM  1/10  MESONET
   1 ESE LANTANA        14.79   700 AM  1/10  COCORAHS
   BOYNTON BEACH        13.13   800 AM  1/10  MESONET
   1 E LANTANA          12.46   800 AM  1/10  MESONET
   2 NW BOYNTON BEACH   11.00   800 AM  1/10  COCORAHS
   PALM BEACH           10.75   800 AM  1/10  MESONET
   1 SW PALM BEACH SHOR  9.35   800 AM  1/10  MESONET
   1 NNW LAKE WORTH      8.72   800 AM  1/10  COCORAHS
   1 N LAKE WORTH        8.58   800 AM  1/10  COCORAHS
   LAKE WORTH            7.98   800 AM  1/10  MESONET
   JUNO BEACH            7.94   800 AM  1/10  CO-OP OBSERVER
   JUPITER FARMS         6.29   800 AM  1/10  MESONET
   9 WNW PALM BEACH GAR  6.15   800 AM  1/10  MESONET
   NORTH PALM BEACH      5.86   800 AM  1/10  MESONET


The heavy rain was confined to a fairly narrow band hugging the coast.  The rain developed in onshore north of a stationary frontal boundary draped across southern Florida.

Surface weather map with radar for 1:00 a.m. EST January 10.
The storms initially developed over St. Lucie County (north of Palm Beach County and slowly developed southward into Palm Beach County.

Radar image from Melbourne, FL at 9:59 p.m EST. January 9.
Click HERE to see a 6-hour radar loop.

The rain caused a good deal flooding, and many vehicles were abandoned as roads became flooded. A section of I-95 was closed for a time due to the flooding. Sadly there was one fatality when a car left the road and plunged into water 15 to 20 feet deep, drowning the driver.

Thursday, January 2, 2014

Winter's Onslaught Continues into 2014

December 1st marked the start of meteorological winter, and winter got off to an early start and persisted through the month and into the new year in the central and eastern portions of the country.

December temperatures were below normal for most of the western two-thirds of the country. The only area consistently above normal was from the Ohio River Valley through the mid-Atlantic and southeastern U.S.  Temperatures averaged from 12 to 15 degrees below normal from the northern plains into northern Minnesota, and more than 5 degrees below normal in the central and southern plains.

There were a few breaks from the cold weather, particularly in the southern and eastern portions of the central U.S. The breaks were short-lived, though, thanks to an upper level wind pattern that funneled cold air out of the Arctic and into the U.S.

Mean 500 millibar pattern for December 2013. The white arrows depict the direction of the wind flow.


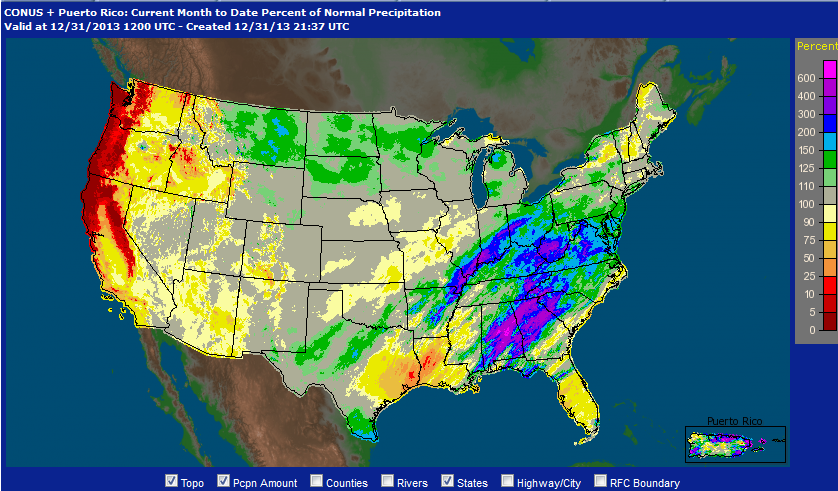
December precipitation was heavy in the Ohio Valley and in the central and southern Appalachians.  It was very dry in northern California northward through Oregon and Washington.  A lot of the precipitation in the northern and central U.S. fell as snow, and at the end of December snow cover was deep across much of Canada and extended southward through the northern tier of the U.S. Of significance is the "snow drought" in the Sierra Nevada in California. Snow pack is only 11 percent of normal in the northern Sierra to about 30 percent of nromal in the southern Sierra.

Percent of normal precipitation for December 2013.

Snow depth (in centimeters) across Canada and the U.S. as of January 1, 2014.

In the near term cold, snowy weather is in the cards for the central and eastern U.S. The eastern U.S. will get short break after the current nor'easter heads out to sea late on Friday. However, another system developing ahead of the next Arctic outbreak will bring snow to the Midwest beginning late Saturday and Sunday and the Northeast late Sunday and Monday. It will be followed by some the coldest air the Midwest and East have seen in the past few years.

Forecast high temperatures for Monday, January 6, 2014


Wednesday, December 18, 2013

Snow to Water Ratios, or How Much Water is in that Snow

If you are a CoCoRaHS observer in a part of the country that receives snow, then you no doubt have reviewed the snow measurement training  that's available on the CoCoRaHS web site, as well as the snow measurement animations on YouTube. You have reviewed these, right?

Taking a snow core
for a water equivalent measurement.
Snow measurement involves several more steps than just measuring what's in your gauge. One of the measurements we ask observers to make is the liquid water equivalent of the new snow measured from a snow core taken from the snow board or other flat surface. Some may ask "Why bother?  Doesn't one inch of water equal ten inches of snow?"   No, not really.

The adage "one inch of rain equals ten inches of snow" is a myth. It happens, of course, but only under certain circumstances. Observers should never "measure" snowfall by using the 10:1 ratio to convert the water in the gauge to snow depth. That's why we ask observers to measure the depth of new snow, and to measure the liquid water equivalent of that snow.

A stellar dendrite snow crystal
So what's with the 10:1 rule? It was first provided to weather observers by the U.S. Weather Bureau in 1875, although it later was qualified to be a rough approximation. It tends to occur or be close to 10:1 when the surface temperature is around 30°F during the snow.  However, the snow to water ratio, or snow density, is dependent on many complex factors. Among these are are the temperature and water vapor within the dendritic growth zone in the clouds (where the temperature is -12°C to -18°C), the depth of the dendritic zone. Dendrites are beautiful, ornate snow crystals that most people are familiar with. Additional factors affecting snow density include the shape of the snow crystals, vertical motion in the clouds, the amount of liquid water in the cloud, and the thermal profile of the layers from cloud level to the surface. Once the snow starts accumulating on the ground, compaction due to the weight of the snow begins to take effect. Wind will also affect the density of the snow. Strong winds break up the snow flakes/crystals into smaller pieces that allow the snow to compact further. Climatologically, the 10:1 ratio tends to occur only over a relatively limited area. A climatology of snow to water ratios was published in 2005 and showed that on average, a ratio of 13:1 was more typical.

30-year climatology of snow to water ratios.
Credit:  A Climatology of Snow-to-Liquid Ratio for the Contiguous United States Martin A. Baxter, Charles E. Graves, and James T. Moore, St. Louis University, October 2005. AMS Journal of Weather and Forecasting


Snow falling on Saturday
Snow to water ratios can change during a storm, and that can be a challenge for forecasters when trying to determine how much snow will result from the amount of liquid water expected. A case in point is the storm that hit my area this past weekend.  The snow started here on Friday afternoon. By Saturday morning at observation time (it was still snowing) there were 6.8 inches of snow that melted down to 0.67 inch of water. The snow to water ratio was 10.1:1. There was little wind during the storm and the snow came straight down, frosting trees, fences, and any horizontal surface, turning everything into a winter wonderland. It continued snowing until about noon Saturday at which point there was another 1.7 inches of snow. However, the lower levels of the atmosphere had warmed some so the snow was denser. That snow melted down to 0.28 inch of water for a snow to water ratio of 6.1:1. That's quite a difference.

Another 0.8 inch of snow on Sunday night melted to 0.06 inch water for a snow to water ratio of 13.3:1.  So over a period of a little over 48 hours I measured 9.3 inches and snow to water ratios ranging from 6:1 to 13:1.

In general, the colder it is, the less dense the snow will be. Snow falling at 20°F will tend to be dry and "fluffy" while snow at 32°F will tend to be wetter and denser, the good-packing snowball-making, snowman-making kind of snow.

Tuesday, December 3, 2013

Brrr-ace Yourself!!

We've had some cold weather in the last two weeks, but nothing like what will occur over the next several days. In the upper atmosphere a broad trough low pressure extends across the continental U.S.  and over the next several days that trough will deepen as a sharp ridge develops just off the west coast.

500 millibar map (~18,000 ft.) for 6:00 a.m.Tuesday, December 3

That will clear the way for cold air from the Arctic to plunge southward well into the U.S.  Snow cover is fairly extensive across Canada, but the southern extent of the snow is a little north of normal in the central and northern Plains. That will change over the next few days.


Snow on the ground for December 3, 2013.
Credit: hamweather.com
While the upper air system gets its act together, a complex low pressure system will be organizing over the central Rockies, producing precipitation eastward along and behind the leading edge of the cold air. Winter Storm Warnings are in effect from western Nevada through the central Colorado Rockies, and from the eastern two thirds of Montana across the Dakotas and Minnesota to northwestern Wisconsin.

Watches, warnings and advisories in effect as of 7:40 p.m. CST.
Click this link for the latest version.


Four to eight inches of snow is likely from southern Utah to western Lake Superior, with amounts possibly reaching 12 inches or more in the Colorado Rockies and along the west side of Lake Superior.  On Thursday and Friday a mix of wintry precipitation including freezing rain is possible from southern Oklahoma through Arkansas into western Kentucky and Tennessee.

By Saturday the leading edge of this cold air mass will push off the east and Gulf coasts, but another reinforcing surge of cold air will push through the the central U.S. early next week as  the closed upper low settles in over the Great Lakes.

Forecast 500 millibar map for Tuesday, December 10.
Maximum temperatures are expected to be below zero in the northern Plains northern Great Lakes by Saturday. It will warm slightly and then the reinforcing surge of cold air will bring maximum temperatures back down by Tuesday.

Forecast maximu, temperatures for Saturday, December 7 (left) and Tuesday, December 10 (right).
On Saturday minimum temperatures are expected to be well below zero in the northern Plains and Rockies, and below freezing from the Appalachians to the Sierra Nevadas

Forecast minimum temperatures for Saturday, December 7.

The outbreaks of very cold air over this much of the country in early December do happen, but not very often. Severe cold air outbreaks have occurred in December 1977, 1983, 1989, and 2000. December 1983 still ranks as the coldest December on record for the Midwest, with December 2000 the second coldest and December 1989 the third. The unusually cold weather the first half of December 1977 was followed by a very mild period, and December 1977 ranks as the 27th coldest. However, just after Christmas that year it turned cold again, and the winter of 1977-1978 ended up going into the record books as one of the most severe winters on record for the eastern two-thirds of the country.


So, button up and batten down. Be sure to keep abreast of the latest weather developments at your local NWS office web site. It looks like winter weather will be holding on for much of the country, especially the central U.S., through the middle of the month.

Temperture outlook for the period December 11-17, 2013.
Credit: NOAA/NWS Climate Prediction Center

CoCoRaHS observers, it's time to review snow measurement techniques!  See the training animations at the CoCoRaHS YouTube channel. They are a great refresher and it will take only around 20 minutes to view them all.