Wednesday, July 29, 2015

A Wild Two Days in the North

It was an interesting and exciting start to the week in the northern Rockies, northern Plains, and southern Manitoba. Snow, a long-lived tornado-producing storm, and hurricane force wind gusts were the result of an unusually strong low pressure system that developed over the northern Rockies on Monday and then rapidly intensified as it moved northeast into Manitoba. This system was fed by very warm, humid air to the southeast of the low and cold, dry air to the northwest, and was associated with a strong closed upper level low.

500 millibar map Tuesday, July 28, at 7:00 a.m. showing closed low over northern Montana and southern Manitoba.
Surface map for July 27 at 10:00 p.m. CDT

On Monday there was snow in Wyoming, Montana, and Idaho. There were several inches of snow above 8,000 feet elevation, including snow at ski areas in Jackson Hole, WY and in Glacier National Park in northwestern Montana. Flurries were even reported in Missoula. Temperatures on Sunday in western Montana and northwestern Wyoming were in the mid 80s, but on Monday daytime high temperatures were only in the low to mid 50s.

Surface temperatures at 5:00 p.m. MDT on July 27.


Strong thunderstorms developed northeast of the low pressure system late Monday, and one particularly strong storm developed over southwestern Manitoba during the early evening. This thunderstorm put down a tornado southwest of Melita, Manitoba around 8:30 p.m. CDT.

Radar image showing strong thunderstorm over southwestern Manitoba at 9:41 p.m. July 27. A hook echo is evident on the south end of the storm.


Radar base velocity image for 9:56 p.m. CDT on July 27. The white oval marks where rotation is indicated. Green colors are movement toward the radar. Red colors are movement away from the radar.

The tornado moved north-northeast over the next two and a half to three hours. At 10:55 p.m. CDT the storm was observed near Virden, and it's possible it lasted for a time after that but was not observed because of darkness.


Map showing approximate locations and times of the observed tornado.

It's possible that the thunderstorm produced multiple tornadoes rather than one very long-track tornado, but there was no doubt this was a monster storm. At one time the storm was estimated to be one kilometer (.62 mile) wide. Fortunately the tornado missed populated areas and there were no known serious injuries. The tornado did damage farm buildings, trees, power lines, and actually ripped pieces of asphalt from a highway. Meteorologists from Environment Canada have been investigating the damage and preliminarily assigned it a high EF-2 rating on the Enhanced Fujita scale. The damage survey has been hampered by the fact that the tornado did not hit many structures and spent much of its time over open fields. Of course, for the residents of the area that's a good thing.

On Tuesday the strong low was moving through Manitoba, and the intensifying low generated strong winds across southern Manitoba and North Dakota. Winds gusted to 70 mph and more at several locations in North Dakota, with the highest wind gusts of 76 mph reported at Garrison in central North Dakota and Alkabo in the northwestern corner of the state. Wind gusts in excess of 55 mph were common in western and central parts of the state. In eastern North Dakota winds gusted from 40 to 50 mph with the highest gust 59 at Devil's Lake and McHenry.


Surface map for Tuesday, July 28, 4:00 p.m CDT
Large-scale strong low pressure systems such as this are rare during the summer. This type of system typically occurs in the late fall to early spring, and often is associated with snow and blizzard conditions in the winter.

Thursday, July 23, 2015

Record Rain in Southern California Just a Drop in the Bucket

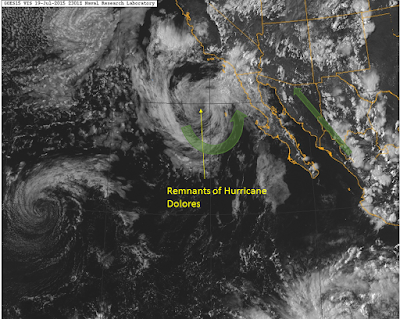
At the start of this week there was some unusual weather in southern California - heavy rain. A low pressure system off the coast that used to be Hurricane Dolores and the southwestern monsoon flow combined to produce showers and thunderstorms from western Arizona west through southern California.

Visible satellite image of the southwestern U.S. at 4:00 p.m. PDT July 19. Green arrows show direction of winds.

Dolores attained hurricane status on July 13 off the central Mexican coast, then moved north northeast parallel to Baja California. It was downgraded to a tropical storm on Friday, July 17. By Sunday, July 19 it had weakened even further and was a post-tropical cyclone.  The circulation was well-defined, and the low pumped moisture from the Pacific into northern Mexico and southern California. This augmented the moist flow of air associated with the southwestern monsoon, and the result was record-breaking July rainfall for many locations in southern California. San Diego has received 1.71 inches of rain in July so far which breaks the old 150 year-old record of 1.29 inches set in 1865.

Some rainfall records in southern California. From NWS San Diego.

One of our CoCoRaHS observers in San Bernadino County received 3.75 inches of rain over two days (by far the highest amount reported so far that I've seen), with a total for the month of 3.83 inches. Seven observers have measured more than 3.00 inches this month, and another several dozen observers have measured an inch of more. Not bad for an area where the normal July rainfall is just a few hundredths of an inch.  Downtown Los Angeles has received 0.38 inches of rain this month. The normal is 0.01 inch.

24-hour CoCoRaHS totals the morning of July 20.

Total rainfall for the period from ~7:00 a.m. PDT on July 18 to &:00 a.m. PDT on July 20 in southern California.

As you might expect, that amount of rain caused problems. Many roads were flooded and washed out. Power was knocked out in some communities. A bridge on Interstate 10 between Coachella, CA and the Arizona state line washed out on the eastbound side and was compromised on the westbound side by flash flooding. The I-10 eastbound lanes are closed indefinitely until the bridge is repaired. The westbound lanes were opened again on Tuesday (July 21). About 27,000 vehicles normal travel this section of I-10 every day.

Firefighters stabilize a pickup truck that drove into washed out I-10 bridge. The driver was rescued.
Photo credit: CalFire Riverside


Map showing location of damaged bridge on I-10 and section closed (yellow).

On Sunday (July 19) the baseball game between the San Diego Padres and the Colorado Rockies in San Diego was first in a rain delay (6th time in history) and then eventually called off. It was only the second time in Petco Park history (since 2004) that a game has been rained out. The last rain-out occurred in 2006.

The rain did little to relieve drought conditions. The rain, while significant, is just a very small drop in a very large bucket. With evaporation rates on the order of 0.20 to 0.25 inch per day what didn't run off will soon be back in the atmosphere. The water balance chart from CoCoRaHS station CA-RV-21 in Riverside, CA shows just how little dent the recent rain made in the water deficit since May 1.


Drought conditions over the western U.S. and particularly California remain unchanged. They are likely to remain unchanged until the wet season begins in the winter, and then only if precipitation occurs regularly and is well above normal.

Wednesday, July 8, 2015

Improving Communication of the NWS Forecast

If you have frequented your local National Weather Service office's web site for your local point forecast through the "point and click" map interface you are familiar with the "forecast-at-a-glance" across the top of the page accompanied by icons depicting the type of weather expected. Effective July 7 the NWS instituted changes to these icons to make them even more representative of the weather expected. Changes include new graphic images for a variety of expected weather conditions. the ability to depict forecast for six-hour intervals, and colored "hazard boxes" to highlight watches, warnings, and advisories in the forecast period.

The icons weren't changed just for the sake of changing them. The changes were made based on research conducted by the National Center for Atmospheric Research (NCAR) in Boulder, CO, and by comments collected from users last year. Researchers surveyed people from across the country and found that most had been frequent and long-time users of the map interface. Researchers tested the former icons and the newly designed icons and presentation format. They found that the colored boxes drew attention to watches and warnings, and users were more aware of hazardous weather threats with the addition of start and end times to the hazard information. If you would like to read more about this research and evaluation see "Improving effectiveness of weather risk communication on the NWS point-and-click web page".

This is the sample forecast presentation that the NWS has on its page explaining the change in format. Note that in periods where the probability of precipitation is increasing or decreasing that change is shown on the icon. A yellow hazard box highlights the period of a severe thunderstorm watch, and also includes the icon for the first period of the forecast. The severe thunderstorm watch is also highlighted in the 12-hour forecasts in the background.  The icon for Saturday depicts the expected weather for both the early and later part of the day.


If there are multiple watches and or warnings, these can be displayed as well. In the example below the forecast for Muskogee, OK for Wednesday depicts a Flash Flood Watch (yellow) into the evening (7:00 p.m. in this case) and a Flash Flood Warning (red) until 1:30 p.m. This information can be seen by clicking the "i" button at the top or on the multiple hazards box.


In the example below, a Red Flag Warning (favorable conditions for wildfire) is in effect for Jordan Valley, OR.


The point and click forecast pages on the NWS web sites receive on average 2 million hits per day, and during major severe weather events that number is substantially higher. If only, say, five percent of those viewing the page have a better understanding of the forecast and weather risk, that's tens of thousands of people who are more aware.

The NWS has a web page that lists all the weather conditions/forecasts and their associated icons (more than three dozen of them). They will continue to accept feedback about the new forecast-at-a-glance presentation and icons, and an email address to do so is provided on the page.