Monday, December 16, 2024

When to Measure New Snowfall

Perhaps one of the most important considerations measuring new snowfall is WHEN to measure new snow. Unlike rain, which stays in your gauge (or should stay in your gauge) until it is measured, new snowfall can come and go in between your regular observations. That particular characteristic requires a different approach to measuring.

The definition of 24-hour new snowfall provides the general information on when to measure new snow. "24-hr snowfall is the maximum accumulation of new snow and ice in the past 24 hours, prior to melting or settling." So, "prior to melting and settling" is the first clue that this may not be at your regular observation time.

Measure new snowfall as soon as possible after it ends, before settling and melting occur. This often will not be at your regular observation time. It might be at 2:00 p.m., or 6:00 p.m., or at 1:00 a.m. If you are also measuring New Snowfall SWE, this is when to make that measurement as well. No matter what time it is, report the new snowfall at your regular observation time.  You can submit a Significant Weather Report with the amount your measured, but you still need to include it in your next regular observation.

Here is a graphic that demonstrates how to measure snow in this situation.


Note that the maximum snowfall is much more than the snow remaining on the ground at 7:00 a.m. the next day

The first question that is often asked is something along the lines of "I am at work during the day and am not home to measure the snow when it ends" or "What if the snow stops overnight while I am asleep?"  Good questions!

If you are not at home during the day when the snow stops, measure the new snowfall as soon as possible after you return home. Write that down for your report the next morning. The snow remaining on the ground in the morning is your snowpack depth. When you submit your observation the next day, please include  additional information in your comments, such as "I was away during the day when the snow stopped - snow measured at 6:00 p.m. Temperatures hovering around freezing and some melting may have occurred before measurement", or any information that will help us interpret your observation.

If snow stops overnight while you are sleeping, the best you can usually do is report what you measure in the morning. (I have been known to go out and measure snow at 3:00 a.m., but that's me.) Again, any additional information you can add to your observation notes will be helpful.

What if you have more than one snow event in a 24-hour period. This graphic demonstrates how to handle that.

Remember, the goal is to capture the maximum accumulation in a 24-hr period, and that means you may have to measure snow before your observation time.

If you haven't done so already, please review our Winter Precipitation Measurements training on the web site.


Wednesday, November 6, 2024

New Mobile App Opens Up the World of CoCoRaHS

CoCoRaHS has utilized a mobile app for a number of years now, both Android and iOS versions. They were developed and maintained by a volunteer who at the time was working on mobile app development. The volunteer's career moved on in a different direction and they no longer have the time to keep up with maintaining the mobile app. We were in a position that, if significant changes to either Android or iOS requirements were made and the mobile app no longer worked, mobile app users would be dead in the water.

The current mobile app has served us well. However, it was mostly a one trick pony. It was limited to entering, listing, and editing daily precipitation data. Some of the error checks that we use on the web site were not utilized in the app. If you want to report hail, significant weather, or condition monitoring you need to use the web site. In addition, observers who exclusively use the current mobile app are less likely to visit the web site and take advantage of all the additional information available to observers.

We realized that the situation with the "CoCoRaHS Observer" mobile app was potentially a disaster waiting to happen. We needed to come up with something that could replace the current mobile app in case changes in operating systems or other issues rendered it unusable. This was a huge challenge. We could not afford to hire someone to develop a new mobile app and then monitor and maintain it. Dealing with the app stores and their requirements was a hassle at times. So, last fall we decided that we needed to come up with an alternative in case things with the current app went irreversibly south.

Mobile light & dark modes
The home page of the new mobile web app in the light and dark modes.

So here we are. The new mobile app is a mobile-enabled web application. It looks like an app, acts like an app, and you can download it from either Google Play or the Apple store as an app. Our app will work across platforms (Android and iOS phones, tablets, computers) and browsers. This new app is full featured, allowing observers to enter data for any of our data types (Significant Weather, hail, etc.) and provides easy access to our current web site.

The development of this mobile app has been an iterative process with a great deal of input from hundreds of observers. When the basic app was ready, we released it to a small group of current and new mobile app users for testing and feedback. Bugs were found and fixed and usability issues addressed. Periodically we released it to additional groups of users for testing and feedback, and the process was repeated. So far, over 600 CoCoRaHS observers have tested this new mobile app. The new mobile app is now available for everyone to use.


What will become of the old app, "CoCoRaHS Observer"? Both the iOS and Android versions will continue to be available as long as they work. They are no longer supported, i.e. there will be no bugs fixed or improvements made. If there are changes to the Android or iOS operating systems that render the app unusable, it will be removed from the Google Play and Apple stores. That will likely happen at some point- we just don't know when.We strongly encourage you to use the new mobile app.

This new mobile app is a significant achievement for CoCoRaHS, thanks to the imagination, knowledge, and skills of our very own Julian Turner. Julian's vision was for a mobile-enabled web site that would have the features of the web site (and then some), be easy to make changes to (no more having to update separate Android and iOS versions of apps), and be the foundation of a new web site structure for CoCoRaHS. We also want to thank the hundreds of observers who tested the mobile app and provided feedback to help improve it. Without you we would not be where we are today.

Here are some of the features of the new mobile app (CoCoRaHS HQ). Note that you can also use this in your computer's web browser. 

  • Enter, list, and enter date for daily precipitation, hail, significant weather, and condition monitoring. (E-T will be added in the future).
  • A Monthly Zeros form
  • A button to set all snow values to zero
  • Buttons to quickly enter Trace and NA/Missing
  • Quick link to the Data Explorer in the View Data menu
  • Station specific Data Explorer shortcuts in the My Data / My Stations view
  • Links to the Precip map and the Condition Monitoring map
  • User settings to choose preferred
    • Units display
    • Light or Dark mode
    • Mobile, Tablet, or Desktop layout
  • Easy access to the primary CoCoRaHS web site through the More menu


To install the app, follow this link for complete instructions:

Installation Guide - CoCoRaHS Mobile App
CoCoRaHS Mobile App
 

Answers to frequently asked questions about the mobile app be found at:
CoCoRaHS Mobile App FAQ

This new mobile app is still a work in progress, and we welcome your feedback.


Tuesday, April 9, 2024

First Tornado Hook Echo Observed 71Years Ago Today

The advances in weather radar over the past 25 years have been astounding. The tools now available to forecasters have greatly improved our ability to detect and warn severe weather. Now, everyone can get live radar feeds on their computers and smart phones. Of course, it wasn't always that way. 71 years ago the first tornado hook echo was observed, by chance, on a research radar in central Illinois. I wrote about this in a blog post on the 60th anniversary of the event. Here is the link to that post:

First Tornado Hook Echo Observed 60 Years Ago Today

Thursday, May 25, 2023

A New Rain Gauge Option for CoCoRaHS

A new approved rain gauge, the Tropo rain gauge from Climalytic Instruments, is now available to CoCoRaHS observers. This is a "premium" alternative to the Stratus gauge manufactured by Productive Alternatives. These are the only two gauges approved for CoCoRaHS (along with the NWS 8" standard rain gauge). I've been seeing a lot of comments about the new Tropo gauge, it's cost, and other things the past two weeks. We realize that many observers cannot or do not want to spend the money for the features it offers. The Tropo gauge incorporates many suggestions made by CoCoRaHS observers over the years for improving the overall gauge. One key difference - it IS more accurate than the Stratus gauge, and it was designed that way. We know the Stratus gauge over-measures rainfall by about 2.5%, and the Tropo gauge does not have that error.

Other features of the gauge that differentiate it from the Stratus gauge:

  • The Tropo holds about 13" of water vs. 11" for the Stratus. This is something that will be useful heavy rain-prone areas, like those that frequently affected by tropical systems. And although we prefer daily observations, the higher capacity also allows for heavier multi-day accumulations
  • The funnel has pre-drilled holes in the rim for mounting the supplied bird deterrent spikes.
  • The funnel and inner measuring tube were designed to make capturing the inner tube with the funnel extremely easy.
  • The inner measuring tube has a wide base for stability in the outer tube and on your counter if pouring water into it.
  • The funnel cap is deeper to minimize splash-out, and locks on to the outer tube to minimize blow-offs.
  • The gauges comes with hardware and a much better designed mounting bracket that easily secures to a post or to a pole.
  • The gauge comes with a handle that slides into the mounting bracket to aid in pouring into the inner measuring tube for measurement. A small pouring spout is molded into the outer cylinder as well to prevent spilling while causing negligible impact to snow core sampling.

There are a number of other improvements as well, and you can read about those on the Climalytic Instruments web site.


Do I Have to Use the Tropo Gauge?

NO. If you are currently using the Stratus gauge there is no need to change unless you want to. We realize that many observers cannot or do not want to spend the money for the features it offers.

Think of it this way. Many weather enthusiasts have home weather stations. An inexpensive weather station can be purchased at your local big box home store, and that will satisfy the needs of many enthusiasts. On the other hand, other enthusiasts want something more and will spend the money for a better system with more features and benefits.


How Accurate is the Tropo Gauge?

The Stratus gauge has a known error of about 2.5 percent (reads 2.5 percent too high). That is within the stated NWS error range of 4 percent from the 8-inch standard rain gauge. The Tropo gauge is accurate to less than 1 percent error. This accuracy is determined by measurement.

The volume of water of a “disc” one inch high and 4 inches in diameter (the outer cylinder) is 205.926 ml (cm3), and it's mass is 205.926 grams. We know there is an error in the Stratus gauge because the volume of water filled to the one inch mark on the inner measuring tube weighs 200.8 grams, not 205.9 grams. A 10-year comparison study of the 4-inch gauge and the NWS 8-inch rain gauge by the Colorado Climate Center found that the 4-inch gauge was higher than the 8-inch gauge by about 3 percent each year. That is consistent with the known accuracy of the Stratus 4-inch gauge.


I Have Both Gauges and the Measurements Rarely Agree.

Even when identical Stratus or Tropo gauges are mounted side by side there will many times be differences in amounts. If all things were equal in an event, the Tropo gauge would be ~0.01" lower at 0.25" in the Stratus, 0.01 to 0.02" lower at 0.50", and 0.03" lower than the Stratus at one inch. So, a measurement difference of a few hundredths between gauges likely has little to do with calibration - it's just a difference caused by any number of things - wind speed and direction, air turbulence around the gauges, rain intensity, etc.

Although the primary field testing has been completed, we are currently continuing field comparisons to not only Stratus PA Gauge, but to the 8" standard rain gauge as well.


Doesn't Using Different Gauges Affect the Interpretation of Precipitation Measurements?

Both rain gauges fall within the +/-4 percent range of the NWS 8" Standard Rain Gauge. Accurate precipitation measurements are the goal, but the reality is that over over the long term there are many other factors that affect gauge catch and precipitation measurements such as wind, rain intensity, siting and exposure, observer error, etc., that are beyond our control.

As a final thought, consider this old adage (Segal's law), reinterpreted for precipitation measurements:

"A person with a rain gauge knows how much rain fell. A person with two rain gauges is never sure."


Thursday, December 1, 2022

Snow Water Equivalent: To SWE, or not to SWE

Snow observations from the dense CoCoRaHS network provide forecasters and other users data and information that would otherwise not be available. The measurements of snow and related snow water equivalent measurements are optional but extremely beneficial. These extra observations take more time and often present challenges that you won't encounter just measuring rain.

There seems to be a good deal of misunderstanding about what exactly constitutes 24-hour Snow Water Equivalent (SWE) and how it is measured. The definition is included in our Glossary of Terms on the CoCoRaHS web site.


The 24-hr Snow Water Equivalent (SWE) is NOT your Gauge Catch, even if the precipitation is all snow. Many observers melt what is in the rain gauge, report that correctly as their Gauge Catch, and then incorrectly copy that value into the 24-hour Snowfall SWE field.

"If all of the precipitation was snow, aren't the gauge catch and 24-hour SWE the same?"

Maybe.

The amount melted in the gauge and the 24-hour Snowfall SWE are two distinct and separate measurements and often not the same value. They might be the same, especially in a light snowfall with little or no wind. An entry should be made in the 24-hour Snowfall SWE field only if the observer takes a snow core from the board or other flat surface, melts the core and measures it. This is the value that is entered for 24-hour SWE.

Why do we do a separate measurement of the snow water equivalent? The 4-inch rain gauge is not a great snow collector. Depending on conditions during a snow event, especially wind, it may catch too much or too little of the snow. If done correctly, the SWE measurement is usually more representative of the amount of water in the snow that fell.

If you do not take and measure a core of snow (and it is optional), then the 24-hour SWE value should be left as NA.

Here is a graphic that demonstrates how to take a core of snow for a 24-hour SWE measurement.


The 24-hour SWE measurement should be done at the same time as you measure your 24-hour New Snowfall, which should be when the snow ends and before any settling or melting occurs. It often will not be at your regular observation time. For example, if the snow ends late in the afternoon you should measure the snow (and SWE) then and report it at your next regular observation time the following morning.

We have just updated our Winter Weather Measurements training slide program which explains the procedures for measuring new snowfall, new snowfall SWE, snowpack, and snowpack SWE in more detail. If you are interested in making these important winter measurements please take time to review this training. You can view the training program by clicking on the image below.


Tuesday, October 11, 2022

Just 100 Observations

If you are a new observer or even if you have been making CoCoRaHS observations for awhile, you may not be aware of the significance of 100 daily observations.

When you have made 100 daily precipitation observations (multi-day reports not included) the data from your station becomes part of the CoCoRaHS data archived by the National Centers for Environmental Information (NCEI). Daily CoCoRaHS observations are ingested into the Global Historical Climate Network-Daily archive, the data set that includes all daily data from U.S. Cooperative network stations, airport weather stations, and CoCoRaHS. CoCoRaHS is the largest source of daily precipitation observations in the U.S., so you can see how important CoCoRaHS and your observations are to painting the national picture of precipitation throughout the United States. Precipitation normals are also calculated for CoCoRaHS stations based on their longevity and consistency of observations, a valuable addition to the climatology of precipitation across the country.

Once you have submitted 100 daily observations - 100 days, 13 weeks, or a little more than three months - your observations become part of the climate history of your locale, your state, and the country. When you reach that milestone (or shortly thereafter) your accomplishment will be recognized with a certificate from CoCoRaHS headquarters. 


Future milestones (250, 500, 750, 1000, 1500, 2000, 2500, 3000, and every 1000 to 8000+ observations) will also be recognized with a certificate.

Make your observations a daily habit. Be sure to report each day (zeroes are data, too) and you will be part of U.S. climate history!


Tuesday, August 23, 2022

International Lightning - A WxTalk Recap

The July WxTalk webinar featured Ron Holle, a meteorological consultant with extensive experience in meteorological education issues, particularly those relating to lightning safety and the demographics of lightning victims and damages. His presentation,"International Lightning" described global and U.S. lightning occurrence and fatalities. 

World-wide lightning density for 2021

During his presentation Holle described what countries have the most lightning strikes. Brazil is at the top of the list, the United States second, with the Democratic Republic of the Congo and Australia rounding out the top four. India tops the list for fatalities with an average of 1755 fatalities per year. Fatalities in the U.S. have decreased in the past 100 years from around 450 in 1920 to less than 50 in 2020, and Holle describes the reasons for this relatively low fatality rate. Florida leads all states with 49 fatalities in the past 10 years, followed by Texas with 22.

You can view this webinar on YouTube at this link: International Lightning


Past webinars can be viewed in the WxTalk Webinar Series archive which includes descriptions and links to all of the webinars presented since 2011.

 WX is a common abbreviation for "weather". It originated as the Morse code shorthand for the word "weather".


Wednesday, July 20, 2022

The Wet Bulb Globe Temperature - A Measure of Potential Heat Stress

Several years ago I was watching the U.S. vs. Portugal in a World Cup match played in Brazil and there was a reference to something called the Wet Bulb Globe Temperature (WBGT). It was the first time I had heard of this (or paid attention when it was mentioned). That led to a search for more information and a blog post. With extreme heat being in the news these days and hearing some mentions of WBGT I thought it would be a good idea to revisit the topic with some updated information.

Most of us are familiar with the Heat Index used here in the U.S. to describe the combined effects of temperature and humidity as an "equivalent temperature". The Wet Bulb Globe Temperature (WBGT) is a more elaborate and complex method of measuring heat stress. It measures heat stress in direct sunlight which takes into account temperature, humidity, wind speed, sun angle and solar radiation.

There are three temperature measurements that are part of the WBGT calculation. The wet-bulb temperature is measured using an exposed thermometer with its bulb covered by a cotton wick wetted by distilled water. This measures evaporative cooling which in turn is affected by wind, humidity, and solar radiation.

The second measurement is the black globe temperature. This consists of a thermometer centered in a 6-inch black globe. This measurements represents the integrated effects of solar radiation and wind.

The third measurement is the standard air temperature measured by a shielded thermometer (in a radiation screen). This represents the temperature "in the shade" and is the standard air temperature most of us are familiar with.

These three measurements are used to calculate the WBGT as follows:

Tw = wet-bulb temperature
Tg = black globe temperature
Ta = air temperature

WBGT = (0.7 × Tw) + (0.2 × Tg) + (0.1 × Ta)

Indoors, or when solar radiation is not a factor such as at night, the following formula is used:

WBGT = (0.7 x Tw) + (0.3 x Tg)

Since the formula just weights the contribution of the respective temperatures, temperatures can be in either Celsius or Fahrenheit.

The WBGT was developed in the late 1950s by the U.S Department of the Navy in response to heat stroke cases at the U.S. Marine Corps Recruit Depot at Paris Island, South Carolina. It was recommended as an international standard to measure workplace heat stress in 1989.

One reason we haven't heard much about the WBGT until recently is that it is not easily measured. There are ways to calculate it using wind, solar radiation, temperature and humidity measurements, but wind and especially real-time solar radiation measurements aren't readily available. The Heat Index used here in the U.S. uses temperature and humidity, two easily and regularly measured parameters. However, it represents conditions "in the shade" and does not account for wind and sunshine, both of which can make a significant difference on the heat stress on the body. The availability of digital gridded data sets makes calculation of WGBT for individual locations or large areas easier to do.

WBGT values are comparatively lower than corresponding heat index values. Here is a table of comparisons between the WBGT and the Heat Index. Note how when the wind is stronger the WBGT is a little lower, accounting for the cooling effect of the wind. Solar radiation is approximated by percent of sky cover.

Comparison of WBGT and Heat Index for various weather conditions.
Credit: NWS Tulsa

When the WBGT is 80 to 85°F, working or exercising in direct sunlight will stress the human body after 45 minutes.When the WBGT is above 90°F, heat stress will occur after only 15 minutes.
 
There are commercially available instruments available to measure WBGT.  They run about $200 and up, a relatively small expense for the workplace or for a large sporting event. The Occupational Safety and Health Administration (OSHA) has guidelines for workplace heat stress using WBGT.

Devices for measuring WBGT


The Southeast Regional Climate Center (SERCC) recently added a new tool to their suite of climate products that provides a forecast of the WBGT for a specific location out five days, including a range of values for sunny vs. shady conditions. The forecast is updated twice daily and is available for the eastern two-thirds of the U.S. Click on the image below to access the WGBT tool.

The National Weather Service produces a map of WBGT for the country.

Heat is one of the leading weather-related causes of death in the country, so be sure you know your vulnerability and how to avoid heat-related illness.

Friday, June 24, 2022

The Pacific Ocean and the Weather Along the U.S. West Coast - A WxTalk Recap

The May WxTalk Webinar featured Eric Skyllingstad with Oregon State University Corvallis, OR describing the variety of weather along the west coast caused by the proximity to the Pacific Ocean. In the winter, large storms are fed energy by the evaporation of water and can generate intense rainfall and hurricane-force winds when they collide with the coastal terrain.  Summer days often end with a simple wind shift that brings cool ocean air inland.  An important part of these weather events is the exchange of energy, water, and momentum between the ocean and atmosphere over the coastal region. This interaction is what makes the coastal climate much different from most of the interior U.S.


You can view the webinar on YouTube at this link.


Past webinars can be viewed in the WxTalk Webinar Series archive which includes descriptions and links to all of the webinars presented since 2011.

 WX is a common abbreviation for "weather". It originated as the Morse code shorthand for the word "weather".


Monday, June 6, 2022

Revisiting Bird Deterrents, and Clean Rain Gauges

After my blog post on April 5 about keeping birds from using your gauge as a porta-potty a number of observers posted ideas on our Facebook group about their solutions.There is no lack of creativity out there. The most important thing to remember about any solution you come up with is that it does not direct any additional water into the gauge, i.e. nothing can drip or run into the funnel from wires, toothpicks, or whatever.

Dave, our CoCoRaHS observer at PA-BK-48 in Newtown, PA found a commercial solution. Ambient, a company electronic rain gauges and weather stations has a bird deterrent for one of their gauges that will work with the 4-inch CoCoRaHS gauge. 


Ambient bird spikes on 4-inch gauge funnel

The model number for this is WS-2902-BIRDSPIKE and it retails for $15.99. Dave indicated that "ll that was required was for me to trim a few of the black rubber spike holders so it would fit. Scissors worked nicely. All told it was up in 10 minutes from box opening to 'in the field.' It is held with a stainless steel zip-tie like device that can be tightened more later if it loosens over time." Thanks to Dave for letting us know about this solution.

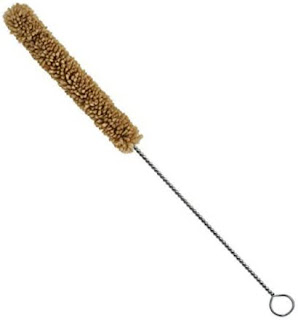
While we are on the subject of birds and the mess they can make in your rain gauge let's talk a little rain gauge maintenance. During the warm season a lot of gunk (algae, dust, etc.) can accumulate in the gauge. There are numerous ways to clean the inner measuring tube. Rolled up newspaper works, as do standard bottle brushes along with a few drops of detergent or bleach. I found a brush that is perfect for he inner measuring tube - sort of like carpet on a stick. It's soft and won't scratch, maintains contact with the entire surface of the tube, and is long enough to reach and clean the bottom of the tube. The brush is 16 inches long and one inch in diameter - perfect for the inner measuring tube. I found mine on Amazon, but a recent check shows it is currently unavailable. It retails under $7 on Amazon. You may be able to find it elsewhere.


Thanks to all those on the Facebook group with ideas and suggestions.


Sunday, April 17, 2022

A Slow Start to the Hail Season

CoCoRaHS' annual Hail Week has come to a close, but this post wraps it up with some additional climatological information on hail. If you have been following this week's Messages of the Day you have seen how to measure hail, report it, and how to make a hail pad. (Mobile app users should select "View message of the day" after submitting you daily observation). Hail is a fascinating phenomena and there is a lot of information available if you want to learn more about it. The CoCoRaHS Hail page  has some information, and you can find a lot more information at Living With Weather- Hail on the Midwestern Regional Climate Center website.

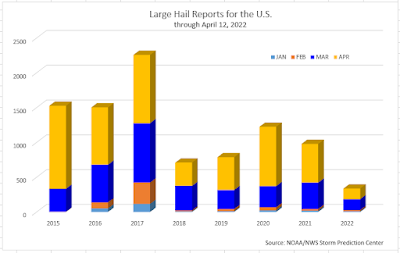
Compared to the past few years this hail season is getting off to a slow start. The total number of March hail reports (155) is the lowest since 2011.

Hail reports for January through April 2015-2022

The peak of the hail season is May, June, and July as can be seen in this chart. Note the downward trend in the number of hail report the past five years.

Total hail reports for each year 2015-2022

Normally probabilities for significant hail very low at the end of February and only begin to ramp up in mid-March to early April. Here are the climatological probabilities for significant hail from the the NOAA Storm Prediction Center for mid-April, late May, and August. The center of the high probabilities moves north through April and May, reaching a peak in late May. By early August probabilities are diminished and continue to diminish into early fall.

So far CoCoRaHS observers have submitted 491 hail reports on 60 days (through 4/12), about the same as last year's 498 reports. This map is a compilation of hail reports for the year through April 12 from the Storm Prediction Center. Note that this map is for reports of hail one inch in diameter or larger.


CoCoRaHS has one of the most comprehensive collections of detailed data on hail. While measuring and reporting hail may seem to be secondary to rain and snow, our hail observations provide valuable information not only to the National Weather Service but to others such as the insurance industry. A 2019 article in the Washington Post noted that Texas has experienced 36 $100 million disasters from severe thunderstorms in the past 25 years. Twenty-nine of these $100 million disasters were from hail!

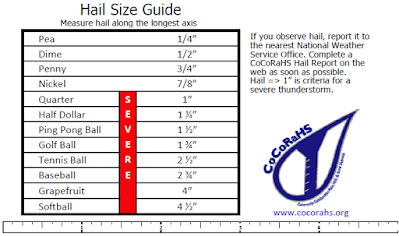
Measuring hail is a core mission of CoCoRaHS, and the separate hail reports on the CoCoRaHS web site allow you to submit your hail information. There are a few things you need to know before measuring hail, and you can find that information in our "Measuring Hail" training animation. Here is a hail size reference and measuring guide you can download, print, and laminate for use. The rule on the bottom is to scale and fits on a 3x5 card. Make multiple copies and keep one at home, in the car, or at work.


Tuesday, April 5, 2022

Keeping Birds Off of Your Rain Gauge

Spring...when flowers bloom, gardens get planted, and birds sometimes decide to use the 4-inch rain gauge for a perch and/or a porta-potty. Although a properly perched bird or two can be a great photographic opportunity, more often than not they leave a mess. What can you do to discourage our feathered friends from perching on the gauge while at the same time not affecting the catch of the rain gauge?  A few years ago Nolan Doesken, CoCoRaHS founder, put out an appeal for suggestions on how to deal with this problem. He received quite a range of ideas. Here are a few of them.

  • Use tape to attach tooth picks or thin, rigid wires to the rim of the gauge about every1 ½ to 2 inches and sticking up about 2" above the rim.
  • Mount a ring of stakes with flags or streamers or shiny stuff around your gauge making sure they stick up a bit higher than the gauge. You can now even purchase holographic ribbon tape that is claimed to scare away birds.
  • Real cats
  • Stuffed cats
  • Rubber snakes
  • Real snakes
  • Plastic owls
  • Electronic owls
  • WD-40 or similar smelly solvent/lubricant applied to the outside of the funnel. A problem with this is that it will likely have to reapplied often, and it could be messy.

I tried one trick suggested by an observer in our CoCoRaHS Facebook group last year. They suggested putting something in the vicinity of the gauge higher than the top of the funnel. Birds often perch on the funnel because it's the highest vantage point in the area. If you give them something that is higher than the gauge, they will tend to use that instead. This could be a shepherd's hook plant hanger or something similar. I attached pieces of scrap wood to my post in an "L" configuration. This seemed to work well as I only had one to two instances of "improper use of the funnel". 


If you search "birds" in our Facebook group you will find photos of some rather ingenious wire configurations to deter birds. Here is one of my favorites (which no doubt took a lot of work) by Richard Martin. If I were a bird I'd think twice about getting close to this one!

 No photo description available.

Two things to keep in mind if you are creating your own deterrent. Nothing should be in the funnel, and any wires, etc. should be bent slightly away from the funnel so that water doesn't collect on them and drip into the gauge.

The toothpick/wire idea is probably the easiest. Here are some instructions on making the toothpick deterrent.

  1. Cut about a 14 inch long piece of ¾ duct tape. Lay it adhesive side up on a flat surface, and fasten down each end with a small piece of tape.
  2. Arrange toothpick on the tape about one to one and a half inches apart. Round toothpicks are best – the have a little more heft to them. Press the toothpicks on to the tape so they adhere.
  3. When you have arranged all the toothpicks, cut the strip free on both ends, inside of where you taped it down.
  4. Wrap the tape with the toothpicks around the edge of the funnel, keeping the top edge of the tape at or just below the edge of the funnel. Overlap the ends, and then press firmly all around the funnel.

For the photos below I used masking tape, but that will not hold up very long in wet weather. Duct tape or some other moisture resistant tape is best. Since you won’t find duct tape in a ¾” width, you will need to rip a strip approximately that wide from a wider strip. This is easy to do – first snip the end of the wide piece of tape with a scissors, and then rip the narrower piece off.


Good luck with the birds this season.