CoCoRaHS' annual Hail Week has come to a close, but this post wraps it up with some additional climatological information on hail. If you have been following this week's Messages of the Day you have seen how to measure hail, report it, and how to make a hail pad. (Mobile app users should select "View message of the day" after submitting you daily observation). Hail is a fascinating phenomena and there is a lot of information available if you want to learn more about it. The CoCoRaHS Hail page has some information, and you can find a lot more information at Living With Weather- Hail on the Midwestern Regional Climate Center website.
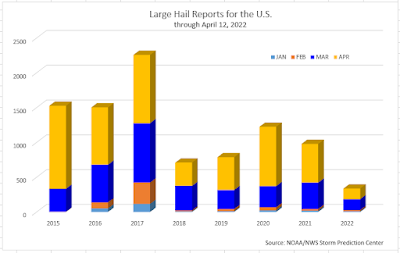
Compared to the past few years this hail season is getting off to a slow start. The total number of March hail reports (155) is the lowest since 2011.
 |
| Hail reports for January through April 2015-2022 |
The peak of the hail season is May, June, and July as can be seen in this chart. Note the downward trend in the number of hail report the past five years.
 |
| Total hail reports for each year 2015-2022 |
Normally probabilities for significant hail very low at the end of
February and only begin to ramp up in mid-March to early April. Here are
the climatological probabilities for significant hail from the the NOAA
Storm Prediction Center for mid-April, late May, and August. The center of the high probabilities moves
north through April and May, reaching a peak in late May. By early
August probabilities are diminished and continue to diminish into early
fall.
So far CoCoRaHS observers have
submitted 491 hail reports on 60 days (through 4/12), about the
same as last year's 498 reports. This map is a compilation of hail reports
for the year through April 12 from the Storm Prediction Center. Note that this map is for reports of hail one inch in diameter or larger.
CoCoRaHS has one of the most comprehensive collections of detailed data
on hail. While measuring and reporting hail may seem to be secondary to
rain and snow, our hail observations provide valuable information not
only to the National Weather Service but to others such as the insurance
industry. A 2019 article in the Washington Post noted that Texas has experienced 36 $100 million disasters from severe thunderstorms in the past 25 years. Twenty-nine of these $100 million disasters were from hail!
Measuring hail is a core mission of CoCoRaHS, and the separate hail
reports on the CoCoRaHS web site allow you to submit your hail
information. There are a few things you need to know before measuring
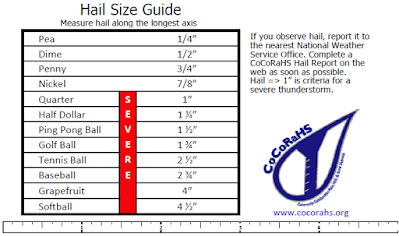
hail, and you can find that information in our "Measuring Hail" training animation. Here is a hail size reference and measuring guide you can download, print, and laminate for use. The rule
on the bottom is to scale and fits on a 3x5 card. Make multiple
copies and keep one at home, in the car, or at work.


No comments:
Post a Comment