Tuesday, January 15, 2013

Record Cold West, Record Warmth East

Low temperature records were set from Oregon and Utah south through southern California the past two days, while in the eastern U.S. record high temperatures were recorded in the southeast and mid-Atlantic.

Surface temperatures at 3:00 p.m EST January 14 (left), and at 7:00 a.m. PST January 15 (right).

The reason for this was a very amplified upper air pattern, with a ridge in the Pacific and a ridge in the Atlantic, with a broad and deep trough in between.

500 millibar map for January 14, 2013
In the west, strong northerly winds aloft brought air south from the Yukon and Northwest Territories. In the east, air was being drawn from the Pacific through Mexico and the Gulf of Mexico.

There were numerous record lows in the west the last two mornings.


LOCATIONCOUNTYRECORDPREVIOUSYEAR
 Period of
ARIZONA


     Record
WILLIAMS COCONINO                       -6 -5 1898
105
SHOW LOW AP NAVAJO                         0 0 1968
45
PARADISE COCHISE                        6 13 1922
31
PAYSON GILA                           8 8 1964
62
WILLCOX COCHISE                        9 9 1963
105
SAN SIMON COCHISE                        9 12 1944
54
BAGDAD YAVAPAI                        11 12 2007
73
DOUGLAS BISBEE INTL AP COCHISE                        11 11 1964
67
NATURAL BRG GILA                           11 11 1964
64
FT THOMAS 2 SW GRAHAM                         11 15 1992
42
AGUILA MARICOPA                       14 15 1964
60
TUZIGOOT YAVAPAI                        15 16 2007
35
SASABE PIMA                           15 19 1963
46
WIKIEUP MOHAVE                         17 19 1964
50
WITTMANN 4SW MARICOPA                       18 20 1963
34
TUCSON INTL AP PIMA                           21 23 1963
68
FOUNTAIN HILLS MARICOPA                       23 31 1992
30
CALIFORNIA


BODIE CA ST HISTORIC PARK MONO                           -27 -26 2007
58
JESS VALLEY MODOC                          -13 -5 1962
62
SOUTH LAKE TAHOE AP EL DORADO                      -11 -7 1997
43
TULELAKE SISKIYOU                       -5 -4 1962
76
MC CLOUD SISKIYOU                       5 7 1932
96
SANDBERG LOS ANGELES   15 20 2007
64
DAGGETT AP SAN BERNARDINO  16 16 1963
64
MT WILSON CBS LOS ANGELES  16 18 1962
59
CACHUMA LAKE SANTA BARBARA 21 25 1955
55
BORREGO DESERT PARK SAN DIEGO                      27 28 2007
45
LOS ANGELES DWTN USC LOS ANGELES 34 36 2007
99
IDAHO


STANLEY CUSTER                         -32 -30 1923
51
GRACE CARIBOU                        -24 -20 2007
101
MAY 2SSE LEMHI                          -20 -15 1960
65
CHILLY BARTON FLAT CUSTER                         -20 -20 1964
62
IDAHO FALLS FAA AP                                -19 -17 1964
53
MACKAY LOST RIVER RS CUSTER                         -18 -18 1932
101
CRATERS OF THE MOON BUTTE                          -15 -9 2007
52
PALISADES BONNEVILLE                     -14 -12 1962
51
PRESTON FRANKLIN                       -14 -10 1985
37
PAUL 1ENE MINIDOKA                       -13 -4 1985
73
IDAHO CITY BOISE                          -13 -11 1930
100
MIDDLE FORK LODGE CUSTER                         -8 -8 2007
41
NAMPA SUGAR FACTORY CANYON                         2 3 1986
31
NEW MEXICO


NAVAJO DAM SAN JUAN                       1 2 1975
46
GRAN QUIVIRA NATL MON SOCORRO                        2 2 1964
76
COCHITI DAM SANDOVAL                       3 5 1977
32
GLENWOOD CATRON                         7 9 1964
60
HACHITA GRANT                          9 9 1989
84
NEVADA


MONTELLO 2NE ELKO                           -27 -14 1932
99
ELY AIRPORT WHITE PINE                     -24 -17 2007
81
RUTH WHITE PINE                     -24 -19 2007
44
BEOWAWE EUREKA                         -21 -20 1962
94
MCGILL WHITE PINE                     -20 -13 2007
104
RUBY LAKE NWR ELKO                           -17 -8 1964
70
BLUE EGLE CURRANT12SSW NYE                            -15 -13 1985
30
OROVADA 3 W HUMBOLDT                       -14 -14 1917
96
LOVELOCK DERBY FLD AP PERSHING                       -12 -9 1962
60
SUNNYSIDE - LUND 31S NYE                            -7 -7 1989
47
DENIO HUMBOLDT                       -3 3 2005
54
TONOPAH NYE                            -3 8 1932
31
PIOCHE LINCOLN                        1 2 1997
78
AMARGOSA FARMS-GAREY NYE                            14 17 1989
36
SEARCHLIGHT CLARK                          15 19 2007
94
OREGON


BURNS MUNI AP HARNEY                         -11 -4 1989
40
HART MTN REFUGE LAKE                           -10 -3 1962
66
HOWARD PRAIRIE DAM JACKSON                        -6 2 1962
51
LONG CREEK GRANT                          2 2 1997
50
MONUMENT 2 GRANT                          5 8 1997
41
MARION FRKS FISH HATCH LINN                           7 8 2007
63
TOKETEE FALLS DOUGLAS                        15 16 2007
57
IDLEYLD PARK 4 NE DOUGLAS                        18 19 1997
52
UTAH


BRYCE CANYON FAA AP                                -30 -13 2007
42
TRENTON CACHE                          -27 -14 1985
34
EPHRAIM SANPETE                        -26 -21 2007
58
PINE VIEW DAM WEBER                          -22 -22 1964
69
SCIPIO MILLARD                        -22 -21 2007
107
NEOLA DUCHESNE                       -19 -16 2007
49
DEER CREEK DAM WASATCH                        -17 -15 1955
73
HEBER WASATCH                        -16 -16 1964
118
VERNON TOOELE                         -16 -7 1964
45
SANTAQUIN CHLORINATOR UTAH                           -12 -9 2007
92
KANOSH MILLARD                        -7 2 1964
42
HANS FLAT RS WAYNE                          -4 2 1989
32
ARCHES NP HQS GRAND                          -4 -3 1989
32
BOUNTIFUL-VAL VERDA DAVIS                          -3 2 2007
32
NATURAL BRIDGES NM SAN JUAN                       -3 0 2011
45
CEDAR POINT SAN JUAN                       -3 0 1989
50
WENDOVER AP AWOS TOOELE                         -2 0 2007
99
CANYONLANDS-THE NECK SAN JUAN                       -1 2 1989
45
CAPITOL REEF NP WAYNE                          0 2 1989
45
BULLFROG BASIN KANE                           9 11 1968
35

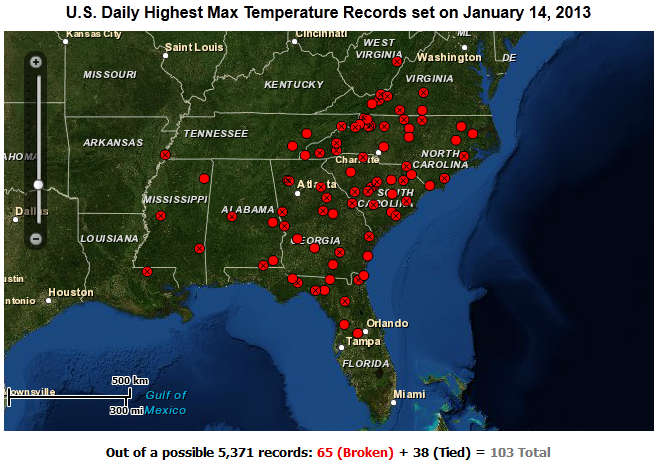
Record maximum temperatures were concentrated in the the southeastern U.S. on Monday, but were recorded as far north as Maine and New Hampshire, including a record tied at Mt. Washington.


LOCATION COUNTY  REC  PREV YEAR   POR
ALABAMA


DOTHAN FAA AP HOUSTON                        79 79 1947 70
GENEVA #2 GENEVA                         78 76 2007 36
CENTREVILLE 6 SW BIBB                           73 71 2007 38
OPELIKA LEE                            72 72 2000 52
ARKANSAS


WEST MEMPHIS CRITTENDEN                     70 67 1995 46
FLORIDA


CLERMONT 9 S LAKE                           83 83 2005 61
INVERNESS 3 SE CITRUS                         83 83 1992 88
MAYO LAFAYETTE                      82 82 1950 61
GAINESVILLE RGNL AP ALACHUA                        82 81 1999 50
JACKSONVILLE INTL AP DUVAL                          81 80 1950 65
TALLAHASSEE WSO AP LEON                           81 80 1971 67
JASPER HAMILTON                       81 81 1972 58
FERNANDINA BEACH NASSAU                         80 80 1972 111
PERRY TAYLOR                         79 77 2007 69
QUINCY 3 SSW GADSDEN                        78 78 1989 39
GEORGIA


SAVANNAH INTL AP CHATHAM                        81 78 2007 68
ALMA BACON CO AP BACON                          80 79 2007 64
MILLEDGEVILLE BALDWIN                        80 76 1937 112
AUGUSTA BUSH FLD AP RICHMOND                       80 73 2007 68
HOMERVILLE 5 N CLINCH                         79 79 1960 55
ALBANY CAA AP                                79 79 2007 37
COLUMBUS METO AP. MUSCOGEE                       78 75 1960 65
PLAINS SW GA EXP STN SUMTER                         77 77 1960 56
ASHBURN 3 ENE TURNER                         77 77 1960 51
SAPELO ISLAND MCINTOSH                       77 77 2000 46
SANDERSVILLE WASHINGTON                     76 76 1960 52
CARTERSVILLE BARTOW                         75 71 1960 66
SILOAM 3N GREENE                         75 73 2000 52
ATHENS BEN EPPS AP CLARKE                         74 71 2007 68
LA GRANGE 1N TROUP                          74 73 1937 71
ALLATOONA DAM 2 BARTOW                         74 72 1995 48
LOUISIANA


CLINTON 5 SE EAST FELICIANA                 79 77 2000 34
MARYLAND


FROSTBURG 2 ALLEGANY                       62 62 2005 40
MAINE


AUGUSTA STATE AIRPORT KENNEBEC                       55 54 2006 64
CARIBOU WFO AROOSTOOK                      52 51 2005 72
MISSISSIPPI


YAZOO CITY 5 NNE YAZOO                          81 77 2007 52
WAYNESBORO 2 W WAYNE                          79 78 1971 90
FULTON 3 W ITAWAMBA                       72 72 2007 54
NORTH CAROLINA


ELIZABETH CITY FAA AP                                79 74 1952 42
NEW BERN - ASOS CRAVEN                         79 74 2007 64
GREENVILLE PITT                           78 78 1932 84
WILMINGTON INTL AP NEW HANOVER                    77 75 1950 80
PLYMOUTH 5 E WASHINGTON                     76 76 2005 65
LEWISTON BERTIE                         75 75 1995 51
LONGWOOD BRUNSWICK                      75 75 2005 38
CONCORD CABARRUS                       74 74 2005 77
BURLINGTON FIRE STN #5 ALAMANCE                       74 74 2005 59
ROXBORO 7 ESE PERSON                         74 72 1960 62
SILER CITY 2 N CHATHAM                        74 74 2005 81
REIDSVILLE 2 NW ROCKINGHAM                     73 71 2005 49
PISGAH FOREST 3 NE TRANSYLVANIA                   72 68 2005 71
YADKINVILLE 6 E YADKIN                         71 70 2005 55
ENKA BUNCOMBE                       71 70 2007 41
NORTH WILKESBORO WILKES                         71 70 2005 55
FRANKLIN MACON                          70 68 1952 64
W KERR SCOTT RSVR WILKES                         70 69 2005 47
MURPHY CHEROKEE                       68 68 2005 44
JEFFERSON 2 E ASHE                           67 63 2007 82
TRANSOU ASHE                           63 63 2007 65
BOONE 1 SE WATAUGA                        62 62 2007 31
GRANDFATHER MTN AVERY                          57 54 2007 55
GREENLAND ROCKINGHAM                     60 60 2005 37
NEW HAMPSHIRE


LEBANON CAA AP GRAFTON                        55 51 2006 46
MT WASHINGTON COOS                           43 43 2005 64
NEW YORK


AVON LIVINGSTON                     68 64 1995 83
DANSVILLE LIVINGSTON                     67 66 1995 86
WARSAW 6 SW WYOMING                        64 57 2006 59
PENNSYLVANIA


RIDGWAY ELK                            69 67 1972 98
MONTGOMERY L&D BEAVER                         68 66 1995 49
TIONESTA 2 SE LAKE FOREST                         68 68 2005 67
CHALK HILL 2 ENE FAYETTE                        64 62 1995 35
BRADFORD 4SW RES 5 MCKEAN                         63 60 2006 65
SOUTH CAROLINA


COLUMBIA UNIV OF SC RICHLAND                       82 80 1932 80
COLUMBIA METRO AP LEXINGTON                      81 73 2005 68
DILLON DILLON                         81 81 1907 81
SUMMERVILLE 4W DORCHESTER                     80 80 1907 111
FLORENCE RGNL AP FLORENCE                       79 75 1995 65
CHARLESTON INTL. AIRPORT CHARLESTON                     79 78 1932 83
JOHNSTON 4 SW EDGEFIELD                      78 73 2000 54
BISHOPVILLE 1ENE LEE                            77 77 2005 71
SANDHILL RSCH ELGIN RICHLAND                       77 72 1995 51
MCCOLL 3 NNW MARLBORO                       77 75 1937 75
BAMBERG BAMBERG                        76 72 2005 58
ANDREWS GEORGETOWN                     76 75 2005 42
PELION 4 NW LEXINGTON                      76 72 2005 50
LAURENS LAURENS                        75 75 1937 94
MANNING CLARENDON                      75 75 2007 38
NINETY NINE ISLANDS CHEROKEE                       73 71 2005 50
TENNESSEE


ERWIN 1 W UNICOI                         74 71 2005 33
KNOXVILLE EXP STN KNOX                           71 71 1995 32
ATHENS MCMINN                         70 70 2005 48
VIRGINIA


SOUTH BOSTON HALIFAX                        73 73 2005 31
MARTINSVILLE FLTR PLT HENRY                          72 70 2007 64
PULASKI 2 E PULASKI                        71 63 2007 56
APPOMATTOX APPOMATTOX                     70 69 1995 46
STAFFORDSVILLE 3 ENE GILES                          70 65 2005 42
WYTHEVILLE 1 S WYTHE                          70 70 1932 94
BLACKSBURG NWSO MONTGOMERY                     69 65 1960 58
WEST VIRGINIA


SNOWSHOE POCAHONTAS                     54 52 2005 36

Friday, January 4, 2013

Big Snow in Big Bend

An upper level low pressure trough produced winter weather over a portion of Texas that doesn't see snow very often. Last night Winter Storm Warnings were in effect in the Big Bend area of Texas for heavy snow in areas west of the Pecos River, and a wider area was under Winter Weather Advisories.

The storm delivered as promised. Eight to ten inches of snow was measured in the higher elevations of southwest Texas. Many other locations from El Paso to San Angelo set daily snowfall records. Granted, many of the daily snowfall records for that part of Texas are in the one to two inch range and a number of them date back 40 to 60 years. Four to five inches of snow fell in the San Angelo area, and observers in El Paso measured 2 to 4 inches of snow. The official snow fall in San Angelo was 2.8 inches, breaking the old record of 0.4 inches in 1972.


PUBLIC INFORMATION STATEMENT...UPDATE
NATIONAL WEATHER SERVICE MIDLAND/ODESSA TX
200 PM CST FRI JAN 4 2013 /100 PM MST FRI JAN 4 2013/

...PUBLIC INFORMATION STATEMENT...

SNOWFALL REPORTS FROM LOCAL OBSERVERS AS OF 2 PM CST FRIDAY...

INCHES       LOCATION       COUNTY     STATE
--------------------------------------------
0.50         SNYDER         SCURRY      TX
1.00         MONAHANS       WARD        TX
3.00         ARTESIA        EDDY        NM
6.50         BIG LAKE       REAGAN      TX
2.00         SEMINOLE       GAINES      TX
3.00         ALPINE         BREWSTER    TX
4.00         MARFA          PRESIDIO    TX
4.00         RANKIN         UPTON       TX
4.50         VAN HORN       CULBERSON   TX
6.00         SANDERSON      TERRELL     TX
6.00         FORT STOCKTON  PECOS       TX
5.50         CARLSBAD       EDDY        NM
10.0         TERLINGUA      BREWSTER    TX
3.00         EUNICE         LEA         NM
1.00         TATUM          LEA         NM
4.00         LOVING         LEA         NM
4.00         JAL            LEA         NM
10.0         FORT DAVIS     JEFF DAVIS  TX


Other daily snowfall records were Abilene with one inch of snow, tying the record set in 1958; Dalhart. also with one inch of snow tying the record set in 1957; and a trace in Austin Camp Mabry, tying the record set in 1972. The official snowfall amount in El Paso was 2.9 inches. also a new record for the date. While El Paso has an average annual snowfall of only 6.6 inches, it has experienced some big snows. On December 13-14, 1987 a whopping 22.4 inches of snow fell, with 16.8 inches of that in a 24-hour period.


Wednesday, January 2, 2013

Snow Blankets More than Half of U.S.

As of today snow covers about 66 percent of the lower 48 states according to analyses from NOAA's National Operational Hydrologic Remote Sensing Center.  A year ago approximately only 19 percent of the U.S. had snow cover. Snowfall has been plentiful in the Cascade  and Sierra Nevada mountain ranges because of the Pacific storms that have rolled through the last few weeks. Winter snowpack is crucial to water supplies in the western U.S.

Thanks to the storms just prior to and after Christmas, snow cover extends from the Ozarks to south of the Ohio river. However, there is an area from Oklahoma, Missouri and through central and northern Illinois into southwestern Michigan that has little snow on the ground. The recent storms have followed a southerly track and there was a sharp cutoff on the northern end of the snowfall area with the storms.

Snow depth reported by U.S. Cooperative weather stations for January 2, 2013.
Chicago has has only received 0.9 inch of snow so far this season. This is the fourth latest that Chicago has made it into the season without having even picked up an inch total of snowfall.In contrast, December 2012 was the seventh snowiest on record in Indianapolis with a total of 14.8 inches of snow.  The Christmas Day storm dumped 17.5 inches on Perry, Arkansas, and 10.3 inches on Little Rock (9.0 inches on December 25, a new record for Christmas Day). As of this morning, though, there is no snow on the ground in Little Rock and only a trace in Perry. 

Thursday, December 20, 2012

A Cold, Stormy End to the Year?

Surface map at 6:00 p.m. CST December 20
The intense low that brought blizzard conditions to parts of the central U.S. and severe thunderstorms and tornadoes to the south is moving through the Great Lakes tonight. The footprint of this winter storm covers the entire country east of the Mississippi River tonight.  Does this storm mark the start of a change in the winter weather pattern? It very well might.

The medium range models are still indicating a change in the upper level pattern in the next week to ten days along the lines of that shown in my December 17th post. The cold air is still bottled up in Alaska and northwest Canada. Fairbanks, for example, just experienced its sixth day in a row with lows -40F or lower and the warmest highs just reaching -19F. It appears that this cold air may be dislodged in the next week or so as an upper level  ridge builds in the eastern Pacific and a trough develops across the U.S.  Both the 6 to 10-day and 8 to 14-day outlooks issued today by the NWS Climate Prediction Center are indicating a higher probability for below normal temperatures across much of the country.


In addition, a series of low pressure systems moving across the U.S. in the next 10 days will likely produce precipitation in the Great Basin and/or the eastern half of the country.

Wednesday, December 19, 2012

Bizzard Warnings from Colorado to Wisconsin

Surface map for 10:00 am EST December 19, 2012
A potent winter storm is spinning up over southern Colorado and northern New Mexico, and the probabilities for high sustained winds and snow have prompted blizzard warnings for an area extending from northeastern Colorado all the way to southern Wisconsin. Winds from 25-40 mph with gusts from 50 to 55 are expected with this storm in the warned area, beginning this afternoon in Colorado and well into Thursday for Iowa and Wisconsin.


NWS Watch/Warning map for 1:26 pm EST December 19
. Counties in orange are under a Blizzard Warning.


Snowfall north and west of the storm center track will be heavy, with  9 to 12 inches or more of snow expected from southwestern Iowa into southwest Wisconsin. Model runs from this morning are indicating the as much as 18 inches of snow could fall in this band.

Probability of at least 12 inches of snow in the 24 hour period ending  6:00 am CST December 20

Forecast snowfall totals by this morning's run of the GFS model.
Image courtesy of Harris WeatherCaster.


This is a dangerous storm, and everyone in the warned areas should take it very seriously. The combination of wind, snow, and low wind chill values will create life-threatening conditions for anyone caught outside. Even where snowfall amounts are expected to be only a few inches the winds will cause very hazardous travel conditions.

Be sure to check your local National Weather Service web site for the latest updates and information on this storm and its impacts on your area. The next round of forecast updates will be done mid to late afternoon.

Tuesday, December 18, 2012

Major Winter Storm on the Way

Residents from the Colorado Rockies to the Great Lakes are bracing for a major winter storm Wednesday and Thursday, while the Pacific Northwest gets a breather between storms today.

Yesterday the large upper trough along the Pacific coast produced more wind, rain and snow in the Pacific Northwest. Winds gusted to more than 80 miles per hour along the coast, and there were blizzard conditions in the mountains where snowfall in the Washington and Oregon Cascades totaled from one to three feet.
CoCoRaHs snowfall map for Washington for December 18, 2012
 
Forecast surface map for 7:00 EST December 19
This large trough will continue to progress east tonight and tomorrow. By Wednesday morning a surface low associated with that trough will be organizing over Colorado. The surface low is expected to move to northern Oklahoma by Wednesday evening, to central Illinois by Thursday morning, and then to southwestern Michigan by Thursday evening. It will be rapidly intensifying during the day on Thursday and along with the snow will be high winds.

 In the mountains of northwest Colorado up to 20 inches of snow is expected, and to the east significant snowfall is expected from Nebraska to the upper Great Lakes. Another system moving in from the Pacific will being more heavy snow to the Pacific Northwest.

Probability of 4 or more inches of snow for the period from Wednesday evening
to Thursday evening (left), and from Thursday evening to Friday evening (right).
As you might expect, a variety of winter advisories, watches, and warnings are in effect from the Rockies to the Great Lakes.

Watch/warning map valid as of 4:45 pm EST December 18.
Orange is a Blizzard Warning. Pink is a Winter Storm Warning.
Blue area surrounding pink is a Winter Storm Watch.
This is a great time for CoCoRaHs observers in the Plains and Midwest to review snow measurement procedures. Check out the snow measurement videos on CoCoRaHS YouTube channel, and/or the "In Depth" Snow Measurement training slide show on the CoCoRaHS web site.


Monday, December 17, 2012

"It'll be a cold day in..."

Temperature map for 2:00 p.m. EST December 17, 2012
...interior Alaska, for one. The lower 48 has enjoyed a relatively balmy December so far, and many are probably wondering where the cold air has been.  Yesterday the high in Fairbanks was -37°F after a morning low of -47°F with about 20 inches of snow on the ground.  Temperatures in interior Alaska for the last couple days have ranged from lows of -50°F to highs of only -45°F! 


So far this winter the cold air has been bottled up in Alaska, the Yukon and the Northwest Territories of Canada, and the entire lower 48 has experienced very mild December weather. 


 The reason for this is that the upper level wind patterns have been generally zonal this month, that is, the winds have been flowing west to east without many undulations north or south. The map below is the average 500 millibar pattern (about 18,000 to 20,000 feet high) for the first 16 days of December. The winds flow along the lines on the map.

Mean 500 mb heights for December 1-16
As you can see, in general the source of air for much of the U.S. has been the Pacific, not the Arctic, and thus the mild weather so far this month.

Will the cold break loose, and when?  The medium range models have been hinting at a change in the next 10 to 14 days.  There are indicating a ridge developing in the eastern Pacific and deep trough to develop over central Canada and the central U.S.  Should that occur, the dam will finally break and the cold air now parked over Alaska and the Arctic will come spilling south.  Here's a forecast 500 millibar map for New Year's Eve that shows the type of pattern that could mean very cold weather for the central and northern U.S.  Note the nearly north to south lines over and est of the Canadian Rockies indicating northerly winds.


This forecast map for New Year's Eve will change as we get closer to that date, so the usefulness of such a forecast now is that it hints at a change in the upper air pattern. It will be something to keep an eye over the next week or so.  In the meantime, enjoy the mild December weather.


Wednesday, December 12, 2012

Fireballs in the Sky

Location of the Geminid meteor shower.
This image is from meteorshowersonline.com.
One of the events our family looks forward to in the summer is the Perseid meteor shower in mid-August. We live out in the country and have a good view of the north and northeast sky, which is perfect for viewing this shower.

This week there is another opportunity to view a meteor shower, the last "regular" meteor shower of the year. The Geminid meteor shower will occur from late night on December 13 until dawn on Friday, December 14. This shower often produces 50 or more meteors per hour, up to as much as 100 per hour.  This year, a new moon means a dark sky on the peak night of the Geminid shower (mid-evening December 13 until dawn December 14). The peak usually occurs around 2:00 a.m. local time, but meteors should be visible beginning about 9:00 or 10:00 p.m. local time. The shower is named the Geminid because the radiant (the point where the meteors appear to originate) appears to come from the constellation Gemini. This will be visible in the northeast sky. If you have a smart phone, there is a neat free app called Google Sky Map which helps you find constellations or other astronomical features from your location.

While the new moon is favorable for viewing, the weather in much of the U.S. won't be ideal. A ridge of high pressure will be slipping off of the east coast late Wednesday, and the weather will be most favorable from the mid-Atlantic coast into the Gulf States and then to central Missouri. Clouds associated with a frontal system snaking its way from Quebec through the Central Plains to southern California will muck thing up for areas just south and to the north of the front. Low level moisture being pulled into Texas by the southerly winds on the back side of the ridge will likely result in cloudiness that hampers viewing there.  A trough of low pressure heading out of the Front Range will keep skies cloudy in the Central Plains.

Forecast surface map for Wednesday, December 13, 2012 at 6:00 p.m. CST.
The area within the  yellow line should have the most favorable viewing conditions for the Geminid meteor shower.

Tuesday, December 11, 2012

December Tornadoes in the South

Surface map at 6:00 a.m. CST on December 10, 2021
Eight  tornadoes touched down in Louisiana, Mississippi, and Florida yesterday as severe thunderstorms developed ahead of a strong cold front. This cold front was part of the same system that brought snow to the Northern Plains and upper Midwest over the weekend. Three tornadoes were confirmed in Louisiana between Baton Rouge and New Orleans early Monday morning. Survey teams rated the damage as EF1 for all three tornadoes, and there was also some straight line damage. You read more information about these tornadoes on the NWS New Orleans/Baton Rouge web site.

Two EF0 and one EF1 tornadoes were confirmed in southern Mississippi on Sunday evening and Monday morning. The Jackson, MS National Weather Office web site has more information on these tornadoes.

On Monday afternoon rotating thunderstorms spun up two tornadoes in east-central Florida. An EF1 tornado touched down near Edgewater, and a waterspout was confirmed near Lake Apopka. More information on these storms can be found on the NWS Melbourne, FL web site.

Northern Florida CoCoRaHS map for December 11, 2012
Last night heavy thunderstorms brought 2.00 to more than 4.00 inches of rain to northern Florida. Tonight that cold front lies across central Florida, with thunderstorms expected overnight and tomorrow from Tampa eastward through Orlando and Daytona Beach. One half to one and a half inches of rain are possible in the band through Wednesday night. The front is expected to push out into the Atlantic, and cooler, drier weather is expected for much of Florida Thursday into the start of the weekend.


Surface map for 9:00 p.m. CST December 11, 2012

Sunday, December 9, 2012

Snow and Blizzard Conditions in Upper Midwest

Snow whipped by high winds prompted blizzard warnings for eastern South Dakota and southwestern Minnesota today. A small but intense low pressure system over southern Minnesota coupled with a ridge of high pressure across the northern Rockies produced the tight pressure gradient (note the tight packing of the isobars - lines of equal pressure- in the map below) that resulted in the high winds.

Surface weather map at 12:00 p.m. CST today

Snowfall amounts were heavy, with 12 to 17 inches of snow reported in a band across south-central Minnesota as of this evening, stretching from the South Dakota border to north of the Twin Cities. It is still snowing in some areas and final snowfall totals may be higher. Below is the snowfall map for the 48 hour period ending at 7:00 a.m. local time today

This map is an objective analysis of NWS Cooperative Observer Program (COOP)
and Community Collaborative Rain, Hail and Snow Network (CoCoRaHS) snowfall reports.
The map is produced by the NWS.
The CoCoRaHS snowfall map for Brookings County, South Dakota this morning shows amounts from 10 to 12 inches. Brookings County is in east-central South Dakota along the Minnesota border

24 hour snowfall map for Brookings County, SD for December 9, 2012