Friday, October 16, 2015

October 15 - A Very Dry Day in North America

Precipitation map for October 15, 2015
I am always struck by the number of grey dots (zero reports) on the CoCoRaHS map when precipitation is generally absent from the map. October 15 was one of those days.  Out of 8791 reports submitted in the U.S. and Canada (as of this post), 7867, (89.5 percent) were zero reports. That's pretty remarkable in a couple of aspects. A dry day such as this is pretty rare across the continent. There have been only 14 days where there have been 80 percent or higher zero reports this year. As you can see from the chart below the vast majority of days have 60 percent or less zero reports, and it's rare to have 40 percent or less, i.e. on any day the number of zero reports is usually between 40 and 60 percent of the total reports submitted.


The day that has the highest percentage of zero reports so far this year is March 7. On that day 9348 (93.5 percent) of the 10006 reports submitted were zero reports. In terms of raw reports, May 3rd leads the list with 9588 zero reports, 86 percent of the 11215 reports submitted. What's really interesting is how similar the surface and upper air weather maps are for March 7th and October 15th.


Surface map for March 7, 2015 (L) and for October 15, 2015 (R)

500 millibar maps for March 7, 2015 (L) and October 15, 2015 (R)


We constantly remind observers that a zero report is an observation. When you submit that zero it says "I observed no precipitation". If you submit only when it rains or snows, then we don't know if days with no measurement are zero, or it's missing for some other reason. "No report" is ambiguous. Zero reports are important to drought monitoring. They are necessary for climatological calculations (daily and monthly averages, for example). On top of it all, zeroes are easy to report. When you log in to CoCoRaHS, the default precip amount is zero. Hit SUBMIT on the page and you're done.  If there is a stretch of dry weather and you haven't been able to enter your observation each day, you can use the Monthly Zeros Report to submit these. Just click the box on the dates you had zero, then submit he report. A daily report will be generated for each of those days. It can't get much easier.

How to complete a Monthly Zeros report


A couple of years ago I came up with "Be a hero, report your zero!" while encouraging an observer to report zeroes. That may be overstating it a bit, but it rhymes and gets the point across. Observers who report every day tend to have complete records, and the more complete records we have the better. Long-term records are gold to climatologists.


Tuesday, October 6, 2015

The Great South Carolina Rain

It was hard not to follow the weather events in the southeastern U.S. this past weekend. While Hurricane Joaquin grabbed a lot of the attention, the well-forecast heavy rain in the Carolinas played second fiddle for the first day or two. Hurricane Joaquin, to be sure, was no slouch and hit the Bahama Islands hard. The devastation was focused on the southeastern Bahamas, particularly Crooked Island, Acklins Island, Long Island and San Salvador. Fortunately, the hurricane stayed well away from the U.S. mainland.


While Hurricane Joaquin did factor into the record-setting rain in South Carolina, the heavy rain would have occurred without the hurricane. I wrote about the possible forecast issues with this system last week, the main concern being the stalled upper level trough in the eastern U.S. At that time it appeared that the bulk of the rain would be from North Carolina northward into New England. The trough did form a cutoff or closed low over the southeastern U.S. by Friday morning as forecast. There it sat through Saturday and Sunday, finally starting to ease out over the Atlantic Monday morning.

500 mb maps for 8:00 a.m. EDT Friday, October 2 (left) and Monday, October 5 (right).
 
A surface low was located east of the upper air low, just off the coast. There was a strong onshore flow from the surface to the mid-levels of the atmosphere.


Surface analysis for 8:00 a.m. EDT Saturday, October 6.


This system tapped very moist, tropical air over the Atlantic and setting up an atmospheric river of moisture feeding the storms over the Carolinas. The east coast system also tapped into the very warm moist outflow associated with Hurricane Joaquin. You can read some more about this interaction in this article by Dr. Marshall Shepherd of the University of Georgia.

Satellite water vapor loop showing moisture flow into South Carolina and Hurricane Joaquin.
For a more technical summary of the meteorology behind the rain this weekend in the southeast, see this article by the Capital Weather Gang at the Washington Post.

Rainfall amounts reported in eastern South Carolina - many of these from CoCoRaHS observers, were astounding, to say the least. Rainfall amounts over a four-day period exceeded two feet north of Charleston, SC, and near Columbia, SC. Here is a brief list of the highest rainfall amounts from CoCoRaHS observers in South Carolina and southeastern North Carolina.


South Carolina
Station Number Station Name Daily Precip Sum in. Multi-Day Precip in. Total Precip in. # of Reports
 SC-RC-42 Columbia 3.1 E 13.16 13.81 26.97 4
 SC-CR-69 Mount Pleasant 6.4 NE 26.88 26.88 4
 SC-CR-60 Charleston 5.4 SSE 23.61 23.61 4
 SC-WL-4 Kingstree 9.5 NW 23.35 23.35 4
 SC-CR-13 Charleston 4.6 SSE 21.88 21.88 4
 SC-CR-19 Folly Beach 2.5 SW 21.45 21.45 4
 SC-CR-89 Charleston 1.7 SE 21.34 21.34 4
 SC-HR-32 North Myrtle Beach 1.4 ENE 21.18 21.18 4
 SC-BK-29 Pineville 0.3 SSE 21.17 21.17 4
 SC-SM-10 Sumter 0.3 ENE 20.67 20.67 4
 SC-BK-38 Moncks Corner 3.6 E 20.42 20.42 4
 SC-SM-1 Sumter 1.3 SE 20.28 20.28 4
 SC-WL-2 Kingstree 7.9 NW 19.99 19.99 4
 SC-OR-5 Holly Hill 0.4 N 19.83 19.83 4
 SC-BK-44 Bonneau 2.7 NW 19.81 19.81 4
 SC-GT-13 Georgetown 4.9 NNE 19.72 19.72 4
 SC-CR-33 McClellanville 0.5 ESE 19.55 19.55 4
 SC-BK-14 Moncks Corner 3.2 NE 19.48 19.48 4
 SC-DC-37 Summerville 3.3 NW 19.47 19.47 4
 SC-CR-10 Mcclellanville 0.2 ESE 19.41 19.41 4
 SC-CD-2 Manning 8.2 S 19.25 19.25 3
 SC-CD-1 Summerton 8.4 SE 18.92 18.92 4
 SC-CR-26 Mount Pleasant 4.1 NE 18.88 18.88 4
 SC-CR-88 Charleston 2.0 S 18.84 18.84 4
 SC-CR-74 Johns Island 1.8 NE 18.79 18.79 4
 SC-GT-17 Georgetown 4.9 NNE 18.78 18.78 4
 SC-CD-4 Summerton 5.2 SSE 18.58 18.58 4
 SC-CR-82 Charleston 0.6 E 18.56 18.56 4
 SC-BK-37 Wando 1.1 SSW 18.47 18.47 4
 SC-CR-83 Kiawah Island 1.5 NE 18.44 18.44 4
 SC-CR-101 Charleston 2.9 ENE 18.33 18.33 4
 SC-BK-25 Moncks Corner 7.2 SW 18.23 18.23 4
 SC-CR-57 North Charleston 3.5 ESE 18.16 18.16 4
 SC-DC-41 Summerville 1.9 N 18.16 18.16 4
 SC-CR-6 Charleston 6.4 NW 18.15 18.15 4
 SC-FL-9 Effingham 2.2 W 17.95 17.95 4
 SC-CR-49 NWS Charleston SC 17.91 17.91 4
 SC-CR-42 Charleston 2.8 NE 17.87 17.87 4
 SC-BK-40 Daniel Island 0.7 SSW 17.61 17.61 4
 SC-CD-6 Manning 1.9 SSE 17.60 17.6 4
 SC-FL-12 Coward 5.1 NNW 17.51 17.51 4
 SC-GT-4 Georgetown 6.0 S 17.41 17.41 4
 SC-DC-36 Summerville 1.4 SSW 17.34 17.34 4
 SC-CR-4 Mount Pleasant 1.9 ESE 17.25 17.25 4
 SC-HR-61 Conway 6.2 E 17.19 17.19 4
 SC-CR-78 North Charleston 3.1 ESE 17.06 17.06 4


North Carolina
Station Number Station Name Daily Precip Sum in. Multi-Day Precip in. Total Precip in. # of Reports
 NC-BR-28 Calabash 1.2 NNW 21.63 21.63 4
 NC-BR-6 Sunset Beach 1.7 WNW 18.79 18.79 4
 NC-BR-1 Sunset Beach 2.9 NNE 17.67 17.67 4
 NC-BR-27 Varnamtown 1.8 ENE 16.40 16.4 2
 NC-NH-45 Kure Beach 2.4 SSW 5.82 9.4 15.22 4
 NC-BR-34 Leland 2.2 SW 14.85 14.85 4
 NC-BR-61 Southport 2.7 NNW 14.00 14 4
 NC-BR-26 Southport 5.8 WNW 13.46 13.46 4
 NC-BR-53 Southport 0.9 NE 13.42 13.42 4
 NC-BR-14 Southport 1.0 NE 13.05 13.05 4
 NC-NH-31 Bayshore 1.3 ENE 12.74 12.74 3
 NC-BR-30 Oak Island 0.7 W 12.49 12.49 4
 NC-CL-26 Tabor City 3.5 NE 12.29 12.29 4
 NC-BR-13 Southport 5.9 W 11.88 11.88 4
 NC-CM-68 Fayetteville 1.4 SW 6.00 5.63 11.63 4
 NC-NH-35 Wilmington 2.3 SE 11.56 11.56 4
 NC-BR-71 Bolivia 7.8 SW 11.48 11.48 4
 NC-NH-10 Wilmington 8.0 ENE 8.81 2.55 11.36 4
 NC-BR-45 Bolivia 7.6 SW 11.28 11.28 4
 NC-BR-2 Leland 5.7 WSW 11.01 11.01 4
 NC-NH-7 Wilmington 4.4 SSE 6.42 4.59 11.01 3
 NC-CL-17 Lake Waccamaw 3.1 SSW 11.00 11 4
 NC-NH-55 Wilmington 4.2 ESE 10.92 10.92 4
 NC-BR-69 Holden Beach 0.6 E 10.43 10.43 4
 NC-NH-46 Wilmington 6.2 SSE 10.37 10.37 4
 NC-BR-64 Varnamtown 1.3 SSW 10.22 10.22 4
 NC-PD-19 Surf City 0.8 E 10.22 10.22 4
 NC-BR-12 Winnabow 3.6 SE 10.21 10.21 4
 NC-PD-20 Topsail Beach 0.7 E 10.17 10.17 4
 NC-NH-25 Wilmington 4.1 SE 10.11 10.11 4


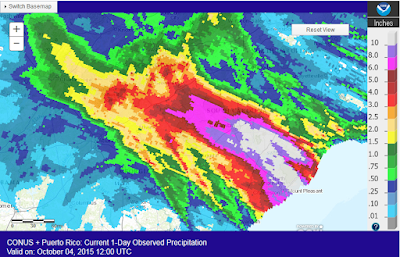
Below are the daily rainfall maps for the three primary days of the storm and the storm total map. It's clear that most of the state of South Carolina received more than six inches of rain from this system, with most of the coastal area of South Carolina and far southeast North Carolina picking up 12+ inches. The amount of 26.88 inches measured by the CoCoRaHS observer in Mt. Pleasant, NC over four days far exceeds the 1000-year, four day amount of 17.5 inches for Charleston. (Recurrence intervals are only published for 1000-year events or less, so the actual recurrence interval for this event was much higher). To further highlight the rarity of this rainfall, the amount of 26.88 inches is higher than the 1000-year, 30-day accumulation for Charleston. All of the superlatives used in describing this rainfall event ("historic", "unprecedented", "incredible") were right on the mark.

24-hr precipitation ending 8:00 a.m. EDT October 3.
24-hr precipitation ending 8:00 a.m. EDT October 4.

24-hr precipitation ending 8:00 a.m. EDT October 5.

Storm total rainfall from 8:00 a.m. EDT October 1 to 8:00 a.m. EDT October 5, 2015.


What's a 1,000 Year Rain?

What do we mean when we say this was a "1,000 year rain"? This is called a recurrence interval, and is another way of saying that the probability of a rainfall amount equaling or exceeding a specified value has a probability of 1 in 1,000, or 0.1 percent in any year. It does not mean that the last time this amount was observed was 1,000 years ago, nor does it mean it will be another 1,000 years before it occurs again. It's just a statistical probability.

Here's a way to visualize this. Let's say we have a box filled with 1000 ping pong balls. One of those ping pong balls is red and all of the others are white. If you reach in to take a ball out of the box, there is a 0.1 percent (1 in 1,000) chance you will pick the red ball. Every time take a ball, you return it to the box. You reach in a second time and take another ball. The probability that you will select the red ball is still 0.1 percent, because you again start with 1,000 balls and only one is red. It is possible that you could select the red ball once, or twice in three draws, or never in 2,000 draws. However, the probability of the red ball in each draw is 0.1 percent. Similarly, a location could experience a 1000-year rain event this year, or again two years from now, or not for another 1,000+ years.  The recurrence intervals are determined of analysis of the precipitation history for that area or location. For example,  the 1,000-year rain for a 24 hour period in Charleston, SC is 14.80 inches, but for Phoenix, AZ the 1,000 year, 24-hour rainfall is 4.82 inches.


The sun was shining in South Carolina today, but the flooding continues on. More than a dozen dams have been breached, road damage is widespread and in many cases severe, and thousands of residents have lost their homes. As of this writing 14 people have lost their lives to the flooding. South Carolinians will be dealing with the aftermath for some time to come.

Finally, thanks to all of the CoCoRaHS observers in South Carolina and North Carolina who regularly reported rainfall during this event despite what were very challenging conditions. Your efforts are now part of the history of this storm.

Tuesday, September 29, 2015

A Soaking Setup for the Eastern U.S.

This has been a quiet tropical storm season so far, at least as far as systems affecting the U.S. mainland. That will likely change this week, but not quite in the way you might expect.

T.S. Joaquin became 10th named storm of the season late last night, developing from a depression that formed between the Bahamas and Bermuda on Sunday. Joaquin  sits about 405 miles northeast of the Bahamas as of Tuesday evening.

Currently, a healthy cold front is crossing through the middle of the country accompanied by a large rain shield.

Surface map and radar at 8:00 p.m. EDT September 29.
Associated with this cold front is a large trough of low pressure aloft that will likely stall along the Appalachians. A low pressure wave will move northeast along the cold front, producing rain, some of it heavy, from the mid-Atlantic through New England. That cold front should be moving off the east coast Wednesday night, but then will become stationary.  An upper level ridge extending more or less west to east from northern New England into the Atlantic will block the progression of the trough over the eastern U.S., and a closed low is forecast to form over the southeastern U.S. Thursday night.


Forecast 500 millibar map for Friday, October 2 at 8:00 a.m. EDT.
Meanwhile, T.S. Joaquin is currently forecast to reach hurricane strength and may make its closest approach to the east coast, possibly off North Carolina, Sunday morning. However, the forecast track of Joaquin is uncertain given the complexity of the upper level pattern over the eastern U.S. As of this post the models have not had a good handle on the situation and there is likely to be further adjustments to its track.

Forecast positions for Tropical Storm Joaquin issued at 5:00 p.m. EDT September 29

So, we have a stalled upper level trough over the eastern U.S., a stationary front off the east coast at the surface, and an approaching tropical storm. All of this adds up to a potential significant heavy rain event along and east of the Appalachians from North Carolina into the Canadian Maritimes.

While Joaquin is not expected to make landfall, the counterclockwise circulation around the storm will be feeding moisture from the Atlantic west across the stationary front. That, combined with the stalled trough aloft tapping moisture from the Gulf of Mexico, will likely result in prolonged and heavy rain along the eastern seaboard. Forecast models are currently indicate that in excess of six inches of rain could accumulate by early next week.

A series of low pressure waves moving along the front on Wednesday and into Friday will produce the heaviest rain in the northeast and New England. Then the focus shifts to the mid-Atlantic region as moisture associated with T.S. Joaquin interacts with the stalled frontal boundary. Joaquin is expected to be eventually absorbed by the main trough aloft and will be reflected as another low pressure wave along the front. That combination will bring rain to the Northeast and New England through this weekend before high pressure takes over on Tuesday.

Quantitative Precipitation Forecasts for the three-day period ending 8:00 p.m. EDT Friday, October 2 (left), and the two-day forecast for the period ending 8:00 p.m. EDT Sunday, October 4 (right).


Quantitative Precipitation Forecast for the 7-day period ending 8:00 p.m. EDT Tuesday, October 6.

 Flood watches are already in place from the central Appalachians through New England through Wednesday. There is still is uncertainty in the how this situation will play out, so be sure to stay abreast of the latest forecasts and advisories if you are in any of the areas to be affected by this system.

Monday, September 28, 2015

The Latest NWS Forecast at Your Fingertips

There are probably hundreds of weather apps and widgets available for your smart phone or tablet. Personally, I have two radar apps (PYKL3 and Radarscope), the Blitzortung Lightning Monitor, and a few "weather forecast" apps. The forecast apps provide a forecast for your local area and have different bells and whistles, depending on the app.

One of my "go to" programs on my smart phone is an experimental widget developed by the Southern Region of the National Weather Service. This widget can be embedded in an existing web page (for example, a web page you have created for your local weather), or can be used as a stand-alone app in a smart phone or tablet. This widget is adaptive, meaning it automatically adjusts the content to the width of the screen of device using it. What I really like about this widget is the organized and compact way it serves up the weather information users want to access on a smart phone. Most National Weather Service web pages do not have mobile versions, and navigating them on a smart phone is cumbersome. (One exception to this is the Storm Prediction Center web site). I'm not a big fan of the new NWS web page design which has, to date, only been deployed in the NWS Eastern and Central Regions. The widget addresses the mobile issue and makes accessing the forecast and other information straightforward and organized.

When you first open the widget, you will get a screen with the NOAA and NWS logos and a message the the widget is loading. It will then display the opening page for whatever location you have chosen.

The opening screen of the widget. The icon to the left of the location entry box opens a Google map where you can select a location. The icon on the right will reload the forecast information for the site you have selected.

On a smart phone, all the information available is collapsed into expandable menus on the screen. Most tablets will be able to display the expanded layout without the collapsible menu.


For example, if you select Detailed Forecast, a window with four tabs is displayed, and you can select the forecast for the time period.


The Radar menu opens to a radar loop of the local NWS radar. If you select the radar map, it takes you to the full web site radar page for that office. The Satellite menu opens to a the full U.S. infrared satellite map. Tap that map and you are taken to the very nice mobile version of the Geostationary Satellite Server from which you can view a number of other satellite images.

The More menu contains links to the full web site for that NWS office and the tabular and graphical forecasts. While these are not mobile versions, you can zoom in as you would on any web page.

To add this to your smart phone or tablet, point your web browser to innovation.srh.noaa.gov/NWSwidget/.  Enter the location you want to have a forecast page for and click Go! Once the page displays, use the "Add to Home Screen" on your browser menu to have the widget readily available on your smart phone or tablet.

Remember that this is an experimental product and could be discontinued or changed at any time. In the meantime, give it a spin.