Showing posts with label flood. Show all posts

Tuesday, March 19, 2019

Inundation - Disaster in Nebraska

The last three days have been some of the "quietest" days, precipitation-wise, on the CoCoRaHS maps in almost two years. It's tragically ironic that on such quiet days a slow, widespread disaster is on-going from the central Plains to the Midwest.

Last week's huge and intense winter storm got a lot of attention due to the extremely high and in some cases record wind speeds measured, record low pressure, and widespread blizzard conditions. While that was big news at the time, the aftermath of this storm turned out to be more insidious and damaging than anything that occurred while the intense low pressure system was spinning over the U.S.

On the warm side of the storm, extending from Texas through the central Plains, warm most air was pulled northward by the strong circulation around the system. Temperatures in the 60s surged through Kansas and into southern Nebraska.


While the air was mild, there was still a lot of snow on the ground, and the soil underneath it was generally frozen.

Snow depth on March 11, 2019.
Credit: NOAA NOHRSC


4-inc soil temperatures under sod for the 24-hour period ending 3/13/2019.
Credit: MRCC Regional Mesonet Program
Rain fell on the warm side of the storm, with anywhere from one to three inches across Nebraska and southern South Dakota in a two-day period.


The mild air and heavy rain resulted in rapid snow melt. With the ground frozen, the water had no where to go except into rivers and streams. The snow across Nebraska held a water equivalent from one to more than two inches, so any runoff from the rain would have that much additional water from the melting snow.

Snow Water Equivalent (SWE) on March 11, 2019.
Credit: NOAA NOHRSC
The melting was rapid and considerable as the storm lifted to the northeast.

These maps show the snow melt for the 24-hour periods ending the mornings of March 13 and March 14. Snow melt was 2 inches per day or more.

By Friday, March 16 snow had disappeared from most of eastern Nebraska and western Iowa, draining into the rivers and streams.


The sudden surge of water running off from the precipitation and melting snow along with ice on the rivers began to compound the disaster. Water flowed from smaller streams into rivers and many then into the Missouri River. While the Missouri River has been getting attention, a number of smaller rivers in Nebraska reached major flood stage.


The Missouri River went from normal to record flood stage at Nebraska City and Plattsmouth in just 48 hours.

Hydrographs for the Missouri River at Omaha, Plattsmouth, and Nebraska City.
In addition to the flooding, huge chunks of ice that recently covered the rivers caused damage to bridges, roads, and fields. Whole towns have been cut off because of flooded or washed out roads. Farmers and ranchers are suffering devastating losses as fields are flooded and damaged by water and ice. Ranchers are having a difficult time feeding or even reaching their livestock, and many lost livestock to either the blizzard conditions or the flooding. An early estimate is that this disaster could result in a $400 million loss to the Nebraska livestock sector.

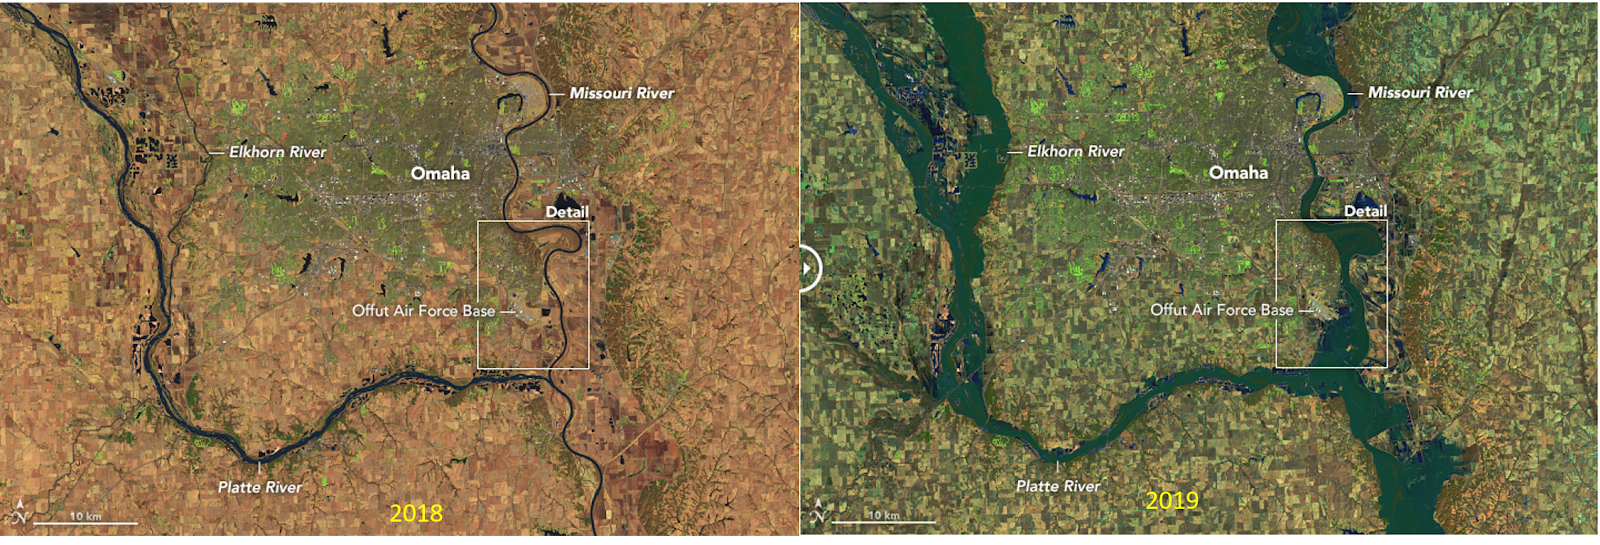
A comparison of eastern Nebraska in 2018 with no flooding (left) with 2019 (right).
Credit: NASA Earth Observatory
The National Weather Service Office in Valley, NE, west of Omaha and between the Platte and Elkhorn rivers had to be evacuated on Friday due to encroaching floodwaters from the rivers Operations were moved to Hastings, NE and forecasters will continue to work from there until floodwater recede and equipment can be checked and made operational. Almost 30 percent of Offutt Air Force Base near Omaha is flooded by the Missouri River. At it's closest extent the Air Force base is a little more than a mile from the river at normal stage.

Close-up view of the Omaha, NE area, 2018 and 2019.
Credit: NASA Earth Observatory
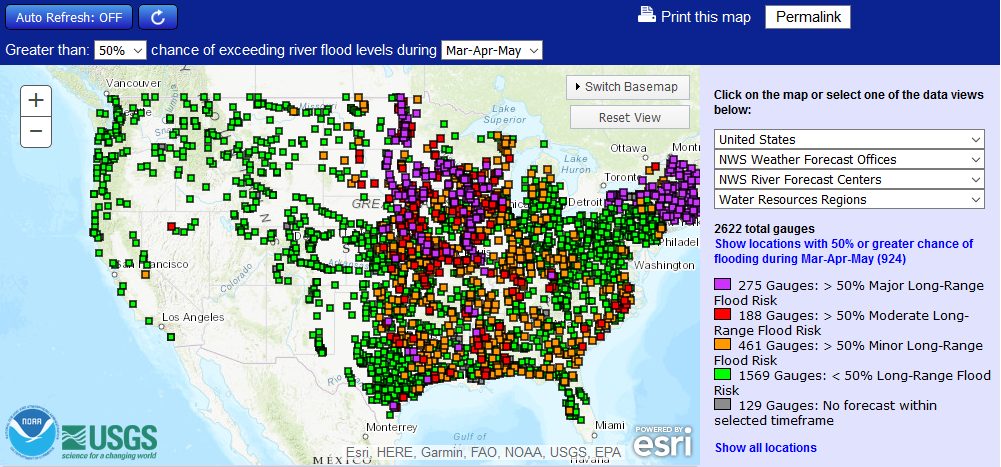
Even though river levels are slowly subsiding in Nebraska, recovery will be long and arduous. The northern Plains and central Midwest are continuing to deal with flooding conditions and it looks like flooding could be a big concern this spring in a large part of the country, particularly the central U.S. and the Northeast. This map shows where there is a greater than 50 percent chance of a flood risk from March through May.


The National Weather Service will be updating its Spring 2019 flood outlook on March 21. You can be sure there will be a lot of people closely paying attention.

Tuesday, October 6, 2015

The Great South Carolina Rain

It was hard not to follow the weather events in the southeastern U.S. this past weekend. While Hurricane Joaquin grabbed a lot of the attention, the well-forecast heavy rain in the Carolinas played second fiddle for the first day or two. Hurricane Joaquin, to be sure, was no slouch and hit the Bahama Islands hard. The devastation was focused on the southeastern Bahamas, particularly Crooked Island, Acklins Island, Long Island and San Salvador. Fortunately, the hurricane stayed well away from the U.S. mainland.


While Hurricane Joaquin did factor into the record-setting rain in South Carolina, the heavy rain would have occurred without the hurricane. I wrote about the possible forecast issues with this system last week, the main concern being the stalled upper level trough in the eastern U.S. At that time it appeared that the bulk of the rain would be from North Carolina northward into New England. The trough did form a cutoff or closed low over the southeastern U.S. by Friday morning as forecast. There it sat through Saturday and Sunday, finally starting to ease out over the Atlantic Monday morning.

500 mb maps for 8:00 a.m. EDT Friday, October 2 (left) and Monday, October 5 (right).
 
A surface low was located east of the upper air low, just off the coast. There was a strong onshore flow from the surface to the mid-levels of the atmosphere.


Surface analysis for 8:00 a.m. EDT Saturday, October 6.


This system tapped very moist, tropical air over the Atlantic and setting up an atmospheric river of moisture feeding the storms over the Carolinas. The east coast system also tapped into the very warm moist outflow associated with Hurricane Joaquin. You can read some more about this interaction in this article by Dr. Marshall Shepherd of the University of Georgia.

Satellite water vapor loop showing moisture flow into South Carolina and Hurricane Joaquin.
For a more technical summary of the meteorology behind the rain this weekend in the southeast, see this article by the Capital Weather Gang at the Washington Post.

Rainfall amounts reported in eastern South Carolina - many of these from CoCoRaHS observers, were astounding, to say the least. Rainfall amounts over a four-day period exceeded two feet north of Charleston, SC, and near Columbia, SC. Here is a brief list of the highest rainfall amounts from CoCoRaHS observers in South Carolina and southeastern North Carolina.


South Carolina
Station Number Station Name Daily Precip Sum in. Multi-Day Precip in. Total Precip in. # of Reports
 SC-RC-42 Columbia 3.1 E 13.16 13.81 26.97 4
 SC-CR-69 Mount Pleasant 6.4 NE 26.88 26.88 4
 SC-CR-60 Charleston 5.4 SSE 23.61 23.61 4
 SC-WL-4 Kingstree 9.5 NW 23.35 23.35 4
 SC-CR-13 Charleston 4.6 SSE 21.88 21.88 4
 SC-CR-19 Folly Beach 2.5 SW 21.45 21.45 4
 SC-CR-89 Charleston 1.7 SE 21.34 21.34 4
 SC-HR-32 North Myrtle Beach 1.4 ENE 21.18 21.18 4
 SC-BK-29 Pineville 0.3 SSE 21.17 21.17 4
 SC-SM-10 Sumter 0.3 ENE 20.67 20.67 4
 SC-BK-38 Moncks Corner 3.6 E 20.42 20.42 4
 SC-SM-1 Sumter 1.3 SE 20.28 20.28 4
 SC-WL-2 Kingstree 7.9 NW 19.99 19.99 4
 SC-OR-5 Holly Hill 0.4 N 19.83 19.83 4
 SC-BK-44 Bonneau 2.7 NW 19.81 19.81 4
 SC-GT-13 Georgetown 4.9 NNE 19.72 19.72 4
 SC-CR-33 McClellanville 0.5 ESE 19.55 19.55 4
 SC-BK-14 Moncks Corner 3.2 NE 19.48 19.48 4
 SC-DC-37 Summerville 3.3 NW 19.47 19.47 4
 SC-CR-10 Mcclellanville 0.2 ESE 19.41 19.41 4
 SC-CD-2 Manning 8.2 S 19.25 19.25 3
 SC-CD-1 Summerton 8.4 SE 18.92 18.92 4
 SC-CR-26 Mount Pleasant 4.1 NE 18.88 18.88 4
 SC-CR-88 Charleston 2.0 S 18.84 18.84 4
 SC-CR-74 Johns Island 1.8 NE 18.79 18.79 4
 SC-GT-17 Georgetown 4.9 NNE 18.78 18.78 4
 SC-CD-4 Summerton 5.2 SSE 18.58 18.58 4
 SC-CR-82 Charleston 0.6 E 18.56 18.56 4
 SC-BK-37 Wando 1.1 SSW 18.47 18.47 4
 SC-CR-83 Kiawah Island 1.5 NE 18.44 18.44 4
 SC-CR-101 Charleston 2.9 ENE 18.33 18.33 4
 SC-BK-25 Moncks Corner 7.2 SW 18.23 18.23 4
 SC-CR-57 North Charleston 3.5 ESE 18.16 18.16 4
 SC-DC-41 Summerville 1.9 N 18.16 18.16 4
 SC-CR-6 Charleston 6.4 NW 18.15 18.15 4
 SC-FL-9 Effingham 2.2 W 17.95 17.95 4
 SC-CR-49 NWS Charleston SC 17.91 17.91 4
 SC-CR-42 Charleston 2.8 NE 17.87 17.87 4
 SC-BK-40 Daniel Island 0.7 SSW 17.61 17.61 4
 SC-CD-6 Manning 1.9 SSE 17.60 17.6 4
 SC-FL-12 Coward 5.1 NNW 17.51 17.51 4
 SC-GT-4 Georgetown 6.0 S 17.41 17.41 4
 SC-DC-36 Summerville 1.4 SSW 17.34 17.34 4
 SC-CR-4 Mount Pleasant 1.9 ESE 17.25 17.25 4
 SC-HR-61 Conway 6.2 E 17.19 17.19 4
 SC-CR-78 North Charleston 3.1 ESE 17.06 17.06 4


North Carolina
Station Number Station Name Daily Precip Sum in. Multi-Day Precip in. Total Precip in. # of Reports
 NC-BR-28 Calabash 1.2 NNW 21.63 21.63 4
 NC-BR-6 Sunset Beach 1.7 WNW 18.79 18.79 4
 NC-BR-1 Sunset Beach 2.9 NNE 17.67 17.67 4
 NC-BR-27 Varnamtown 1.8 ENE 16.40 16.4 2
 NC-NH-45 Kure Beach 2.4 SSW 5.82 9.4 15.22 4
 NC-BR-34 Leland 2.2 SW 14.85 14.85 4
 NC-BR-61 Southport 2.7 NNW 14.00 14 4
 NC-BR-26 Southport 5.8 WNW 13.46 13.46 4
 NC-BR-53 Southport 0.9 NE 13.42 13.42 4
 NC-BR-14 Southport 1.0 NE 13.05 13.05 4
 NC-NH-31 Bayshore 1.3 ENE 12.74 12.74 3
 NC-BR-30 Oak Island 0.7 W 12.49 12.49 4
 NC-CL-26 Tabor City 3.5 NE 12.29 12.29 4
 NC-BR-13 Southport 5.9 W 11.88 11.88 4
 NC-CM-68 Fayetteville 1.4 SW 6.00 5.63 11.63 4
 NC-NH-35 Wilmington 2.3 SE 11.56 11.56 4
 NC-BR-71 Bolivia 7.8 SW 11.48 11.48 4
 NC-NH-10 Wilmington 8.0 ENE 8.81 2.55 11.36 4
 NC-BR-45 Bolivia 7.6 SW 11.28 11.28 4
 NC-BR-2 Leland 5.7 WSW 11.01 11.01 4
 NC-NH-7 Wilmington 4.4 SSE 6.42 4.59 11.01 3
 NC-CL-17 Lake Waccamaw 3.1 SSW 11.00 11 4
 NC-NH-55 Wilmington 4.2 ESE 10.92 10.92 4
 NC-BR-69 Holden Beach 0.6 E 10.43 10.43 4
 NC-NH-46 Wilmington 6.2 SSE 10.37 10.37 4
 NC-BR-64 Varnamtown 1.3 SSW 10.22 10.22 4
 NC-PD-19 Surf City 0.8 E 10.22 10.22 4
 NC-BR-12 Winnabow 3.6 SE 10.21 10.21 4
 NC-PD-20 Topsail Beach 0.7 E 10.17 10.17 4
 NC-NH-25 Wilmington 4.1 SE 10.11 10.11 4


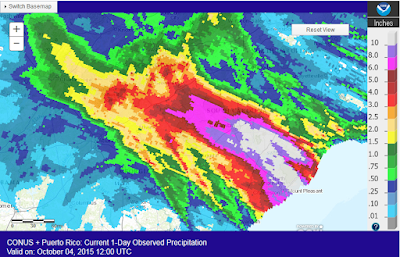
Below are the daily rainfall maps for the three primary days of the storm and the storm total map. It's clear that most of the state of South Carolina received more than six inches of rain from this system, with most of the coastal area of South Carolina and far southeast North Carolina picking up 12+ inches. The amount of 26.88 inches measured by the CoCoRaHS observer in Mt. Pleasant, NC over four days far exceeds the 1000-year, four day amount of 17.5 inches for Charleston. (Recurrence intervals are only published for 1000-year events or less, so the actual recurrence interval for this event was much higher). To further highlight the rarity of this rainfall, the amount of 26.88 inches is higher than the 1000-year, 30-day accumulation for Charleston. All of the superlatives used in describing this rainfall event ("historic", "unprecedented", "incredible") were right on the mark.

24-hr precipitation ending 8:00 a.m. EDT October 3.
24-hr precipitation ending 8:00 a.m. EDT October 4.

24-hr precipitation ending 8:00 a.m. EDT October 5.

Storm total rainfall from 8:00 a.m. EDT October 1 to 8:00 a.m. EDT October 5, 2015.


What's a 1,000 Year Rain?

What do we mean when we say this was a "1,000 year rain"? This is called a recurrence interval, and is another way of saying that the probability of a rainfall amount equaling or exceeding a specified value has a probability of 1 in 1,000, or 0.1 percent in any year. It does not mean that the last time this amount was observed was 1,000 years ago, nor does it mean it will be another 1,000 years before it occurs again. It's just a statistical probability.

Here's a way to visualize this. Let's say we have a box filled with 1000 ping pong balls. One of those ping pong balls is red and all of the others are white. If you reach in to take a ball out of the box, there is a 0.1 percent (1 in 1,000) chance you will pick the red ball. Every time take a ball, you return it to the box. You reach in a second time and take another ball. The probability that you will select the red ball is still 0.1 percent, because you again start with 1,000 balls and only one is red. It is possible that you could select the red ball once, or twice in three draws, or never in 2,000 draws. However, the probability of the red ball in each draw is 0.1 percent. Similarly, a location could experience a 1000-year rain event this year, or again two years from now, or not for another 1,000+ years.  The recurrence intervals are determined of analysis of the precipitation history for that area or location. For example,  the 1,000-year rain for a 24 hour period in Charleston, SC is 14.80 inches, but for Phoenix, AZ the 1,000 year, 24-hour rainfall is 4.82 inches.


The sun was shining in South Carolina today, but the flooding continues on. More than a dozen dams have been breached, road damage is widespread and in many cases severe, and thousands of residents have lost their homes. As of this writing 14 people have lost their lives to the flooding. South Carolinians will be dealing with the aftermath for some time to come.

Finally, thanks to all of the CoCoRaHS observers in South Carolina and North Carolina who regularly reported rainfall during this event despite what were very challenging conditions. Your efforts are now part of the history of this storm.

Friday, July 13, 2012

Houston, We Have a Problem

That problem is rain, and lots of it. A nearly stationary upper level trough along the Gulf Coast combined with a steady flow of moist air from the Gulf of Mexico resulted in torrential rain in the northwest side of Houston for the past couple of days.

This is the water vapor satellite image for Thursday, July 12, 2012 at 2:45 pm CDT. The yellow dashed line marks the upper level trough, and the green arrow depicts the flow of very moist air. The orange area northwest of the trough is dry air, and the white to blue colors depict the moist air.

More than 15 inches of rain have accumulated at some locations since Tuesday, pushing several creeks and rivers to major flood levels.  Numerous homes were flooded with anywhere from a few inches to several feet of water. Some roads were still closed due to flooding late Friday afternoon.


This graph shows the river stage on Cypress Creek. The blue line tracks the observed values, and the purple dots are the forecast stages.


The National Weather Service reported that one rain gauge on the border of Harris and Waller counties recorded 10.30 inches of rain in a 10 hour period.

CoCoRaHS maps for July 12 (top) and July 13 (bottom)
 On the positive side, the three days of rain will likely put an end to the drought in southeastern Texas.