Wednesday, January 29, 2014

Deep Chill in the Deep South

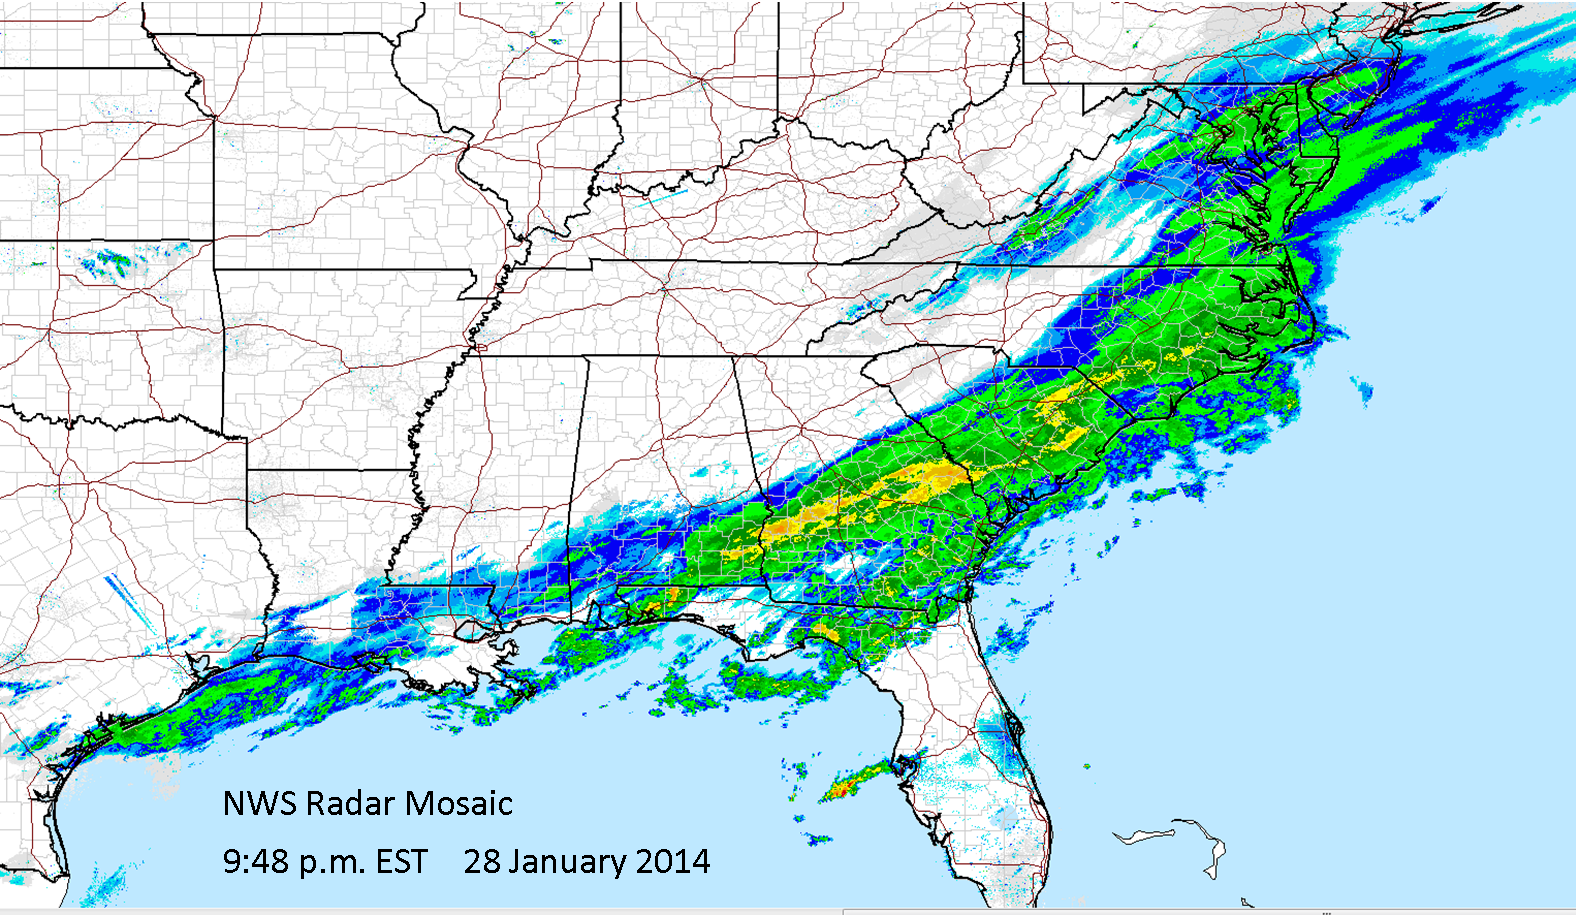
The most recent surge of Arctic not only brought the coldest air of the season but also was the most expansive. After bringing subzero readings to much of the central U.S. the cold air mass knifed into the deep south. The cold front slowed to a crawl as it reached the Gulf Coast states, and warm mosit air riding up over the cold air produced a band of precipitation from Louisianna to Virginia.


Last night the leading edge of the cold air stretched from the middle of the Gulf of Mexico to across northern Florida, and precipitation had beren occurring all day along and behind the front. Wintry precipitation, from freezng rain to sleet to snow, fell from Louisianna into Alabama, Georgia, the Carolinas, and Virginia.

Surface map for 7:00 p.m. EST January 28, 2014


The cold front has advanced into southern Florida, and a band of precipitation continues to affect areas on the cold side of the boundary.


Surface map at 7:00 a.m. EST and radar image at 10:38 a.m. EST January 29, 2014
 
This morning Winter Storm Warnings extended from the Florida Panhandle through Georgia and into southern South Carolina.

Watches, warnings, and advisories as of 10:06 a.m. EST

 Here's a forecast for Tallahassee, Florida you won't see very often.


Snowfall amounts as of 7:00 a.m. EST this morning were as high as 4 to 6 inches in eastern North Carolina to southeast Virginia and from 1 to 3 inches from east-central Alabama across northern Georgia.  Many CoCoRaHS observers in the south got their first experience measuring snow this morning. In North Carolina 5.3 inches of snow was reported by station NC-DR-10 Kill Devil Hills 0.9 WNW on the Outer Banks! Six inches of snow was reported by the observer at NC-NS-18, Elm City 6.3 NW in Nash County.


Traffic cam from Atlanta on the morning of January 29, 2014
Snow wasn't the only problem. Freezing rain and sleet were also mixed in, and in a part of the country where the need for snow removal and ice treatment is rare the wintry precipitation was disastrous. In the Atlanta area snow and ice brought traffic on area roads and Interstates to a paralyzing gridlock. Vehicles moved only a mile in 6 to 10 hours. Many people abandoned their cars to find shelter from the weather, only to make matters worse.  Traffic in the Atlanta area is still a mess this morning and it is likely to be days before things return to normal. Temperatures will climb above freezing tomorrow and the rest of the week, but sunshine won't clear the vehicles from the roads.


Wednesday, January 22, 2014

The Clippers Keep On Comin'

Map showing general path of an Alberta Clipper
Credit:  NOAA
A series of fast-moving low pressure systems have brought surges of bone-chilling Arctic air and mostly light snow to the Midwest and east the past week to ten days. These storms, known as "Alberta Clippers", generally develop on the east side of the Canadian Rockies. Typically there is an upper level trough over the eastern U.S. and these storms ride the jet stream southeastward on the back side of the trough.  They are speedy systems and usually are not very intense. Their fast movement also doesn't allow time for a large amount of moisture to be drawn in to the system and results in generally light precipitation. However, much colder and windy weather typically follow these systems.  The strong, cold winds often result in heavy lake-effect snow in the lee of the Great Lakes. Occasionally a clipper will intensify when it reaches the mid-Atlantic Coast and becomes a much stronger storm, such as the one the affected the eastern U.S. last night and today.

48-hour snowfall ending the morning of January 22, 2014.

There have been several of these Alberta Clippers over the past week or more.  The upper level disturbances produce these clippers have been favored by the strong, persistent upper level trough over the eastern U.S. coupled with the ridge in the eastern Pacific.

Here is the 500 millibar map (~18,000 ft) from this morning with three "short waves" marked. Below that is the surface weather map from this afternoon at 1:00 p.m. EST.  The disturbance just off the east coast is associated with the storm that left up to a foot of snow in New York and New Jersey today. The wave over the northern U.S. is associated with the low and cold front moving through the Northern Plains and Midwest today. Further northwest there is yet another wave moving over the top of the ridge that could produce another clipper in a couple of days.


Surface map for 1:00 p.m. EST 1/22/2014

 This animation of the 12:noon CST weather map for the past ten days shows the progression of the Alberta Clippers across the eastern half of the U.S. along the same general path.

Surface weather maps for 12:00 CST January 12-22, 2014

The path of the clippers is also seen in the snowfall pattern over the eastern U.S. the past ten days.


It appears the current upper air pattern will remain in place for the next week to 10 days, so winter weather will continue to affect the Northern Plains, Midwest and east.

Thursday, January 16, 2014

"It Never Rains in Southern California"

Residents and CoCoRaHS observers throughout California (and not just southern California) may be humming this Albert Hammond song from 1972 with complete justification.  The western U.S. has been suffering through drought conditions for much of the last year, but conditions have worsened in the past three months. Currently 90 percent of California is in at least severe drought, and 63 percent is in extreme drought.


Winter is usually the wet season in California as storms roll in off of the Pacific and produce rain along the coast and snow in the Sierra Nevada. The snow is particularly important for California and the west. Snowmelt in the spring and through the early part of summer is counted on to fill reservoirs that supply water to communities and irrigation for agriculture. The winter snowpack in the northern and central Sierra provides about a third of California's water supply.

Satellite images of the Sierra Nevada range
in January 2013 (left) and January 2014 (right).
Credit: NOAA Environmental Visualization Laboratory
The water equivalent in the snowpack in the Sierra is only 19 percent of normal and that is raising concern for the spring and summer. When snow survey teams headed out on the first survey at the beginning of January found more bare ground than snow in some areas. The current level is the lowest on record along with January 2012.


This series of charts shows the water content of the snowpack as a percent of of the April 1 average. Note that this season to date (pink line) is at or below the driest season on record (1976-1977)
 
Source: California Department of Water Resources
What has happened to the storms that normally bring rain and snow to California? They have been kept at bay by a persistent ridge of high pressure over the eastern Pacific and western U.S.  The corresponding downstream trough over the central and eastern U.S. has been responsible for the cold and snow so far this winter.

Here is the climatological normal 500 millibar level (about 18,000 feet) pattern for the period from December 1 to January 15. The upper level winds flow parallel to the contours on the map Note how in the contours are fairly flat in the western U.S., which means winds tend to steer Pacific storms into the region.


Here is the mean 500 millibar pattern for the last 45 days. Notice the ridging of the contours in the eastern Pacific. Winds steer Pacific storms northeastward over the ridge into Alaska and western Canada, deflecting them away from the west coast.


It is still early in the snow season, and a few large, wet storms in through March could help the situation. However, the U.S. Drought Outlook indicates that drought conditions will persist through the end of April. In addition to water supply problems the extreme drought conditions will mean a volatile wildfire season.

Friday, January 10, 2014

Buckets of Rain in Florida

When I see the CoCoRaHS U.S. map apparently filled with only blue dots my first thought is that there is an observation with a misplaced decimal, skewing the map scale to the high side. That was my thought this morning when I pulled up the web site. I went to check the observations to see where the high value was, and it was quickly obvious that this wasn't an error.


Heavy rain fell yesterday afternoon through last night along the southeast coast of Florida in Palm Beach County. The heaviest rainfall reported was an astounding 22.21 inches in Hypoluxo. The largest amount from a CoCoRaHS observer was 14.79 inches near Lantana. That amount is low, according to the observer, because the gauge was already full when he emptied it just after midnight (the gauge holds about 11 inches).

 
CoCoRaHS reports for Palm Beach County, FL on January 10.


CoCoRaHS observers also reported 10+ inch amounts from Martin and St. Lucie counties. Quite a few observers reported 5 inches or more for this event .Here are some of the highest amounts reported to the National Weather Service so far from Palm Beach County.

...PALM BEACH COUNTY...
   1 WSW HYPOLUXO       22.21   800 AM  1/10  MESONET
   1 SW PALM BEACH      16.03   800 AM  1/10  MESONET
   LANTANA              15.04   800 AM  1/10  MESONET
   1 ESE LANTANA        14.79   700 AM  1/10  COCORAHS
   BOYNTON BEACH        13.13   800 AM  1/10  MESONET
   1 E LANTANA          12.46   800 AM  1/10  MESONET
   2 NW BOYNTON BEACH   11.00   800 AM  1/10  COCORAHS
   PALM BEACH           10.75   800 AM  1/10  MESONET
   1 SW PALM BEACH SHOR  9.35   800 AM  1/10  MESONET
   1 NNW LAKE WORTH      8.72   800 AM  1/10  COCORAHS
   1 N LAKE WORTH        8.58   800 AM  1/10  COCORAHS
   LAKE WORTH            7.98   800 AM  1/10  MESONET
   JUNO BEACH            7.94   800 AM  1/10  CO-OP OBSERVER
   JUPITER FARMS         6.29   800 AM  1/10  MESONET
   9 WNW PALM BEACH GAR  6.15   800 AM  1/10  MESONET
   NORTH PALM BEACH      5.86   800 AM  1/10  MESONET


The heavy rain was confined to a fairly narrow band hugging the coast.  The rain developed in onshore north of a stationary frontal boundary draped across southern Florida.

Surface weather map with radar for 1:00 a.m. EST January 10.
The storms initially developed over St. Lucie County (north of Palm Beach County and slowly developed southward into Palm Beach County.

Radar image from Melbourne, FL at 9:59 p.m EST. January 9.
Click HERE to see a 6-hour radar loop.

The rain caused a good deal flooding, and many vehicles were abandoned as roads became flooded. A section of I-95 was closed for a time due to the flooding. Sadly there was one fatality when a car left the road and plunged into water 15 to 20 feet deep, drowning the driver.

Thursday, January 2, 2014

Winter's Onslaught Continues into 2014

December 1st marked the start of meteorological winter, and winter got off to an early start and persisted through the month and into the new year in the central and eastern portions of the country.

December temperatures were below normal for most of the western two-thirds of the country. The only area consistently above normal was from the Ohio River Valley through the mid-Atlantic and southeastern U.S.  Temperatures averaged from 12 to 15 degrees below normal from the northern plains into northern Minnesota, and more than 5 degrees below normal in the central and southern plains.

There were a few breaks from the cold weather, particularly in the southern and eastern portions of the central U.S. The breaks were short-lived, though, thanks to an upper level wind pattern that funneled cold air out of the Arctic and into the U.S.

Mean 500 millibar pattern for December 2013. The white arrows depict the direction of the wind flow.


December precipitation was heavy in the Ohio Valley and in the central and southern Appalachians.  It was very dry in northern California northward through Oregon and Washington.  A lot of the precipitation in the northern and central U.S. fell as snow, and at the end of December snow cover was deep across much of Canada and extended southward through the northern tier of the U.S. Of significance is the "snow drought" in the Sierra Nevada in California. Snow pack is only 11 percent of normal in the northern Sierra to about 30 percent of nromal in the southern Sierra.

Percent of normal precipitation for December 2013.

Snow depth (in centimeters) across Canada and the U.S. as of January 1, 2014.

In the near term cold, snowy weather is in the cards for the central and eastern U.S. The eastern U.S. will get short break after the current nor'easter heads out to sea late on Friday. However, another system developing ahead of the next Arctic outbreak will bring snow to the Midwest beginning late Saturday and Sunday and the Northeast late Sunday and Monday. It will be followed by some the coldest air the Midwest and East have seen in the past few years.

Forecast high temperatures for Monday, January 6, 2014