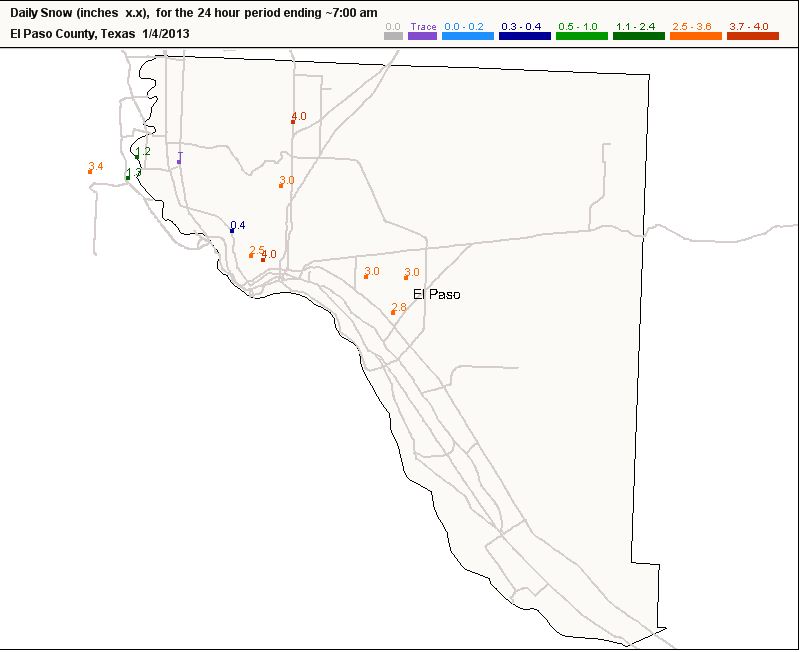
An upper level low pressure trough produced winter weather over a portion of Texas that doesn't see snow very often. Last night Winter Storm Warnings were in effect in the Big Bend area of Texas for heavy snow in areas west of the Pecos River, and a wider area was under Winter Weather Advisories.
The storm delivered as promised. Eight to ten inches of snow was measured in the higher elevations of southwest Texas. Many other locations from El Paso to San Angelo set daily snowfall records. Granted, many of the daily snowfall records for that part of Texas are in the one to two inch range and a number of them date back 40 to 60 years. Four to five inches of snow fell in the San Angelo area, and observers in El Paso measured 2 to 4 inches of snow. The official snow fall in San Angelo was 2.8 inches, breaking the old record of 0.4 inches in 1972.
PUBLIC INFORMATION STATEMENT...UPDATE
NATIONAL WEATHER SERVICE MIDLAND/ODESSA TX
200 PM CST FRI JAN 4 2013 /100 PM MST FRI JAN 4 2013/
...PUBLIC INFORMATION STATEMENT...
SNOWFALL REPORTS FROM LOCAL OBSERVERS AS OF 2 PM CST FRIDAY...
INCHES LOCATION COUNTY STATE
--------------------------------------------
0.50 SNYDER SCURRY TX
1.00 MONAHANS WARD TX
3.00 ARTESIA EDDY NM
6.50 BIG LAKE REAGAN TX
2.00 SEMINOLE GAINES TX
3.00 ALPINE BREWSTER TX
4.00 MARFA PRESIDIO TX
4.00 RANKIN UPTON TX
4.50 VAN HORN CULBERSON TX
6.00 SANDERSON TERRELL TX
6.00 FORT STOCKTON PECOS TX
5.50 CARLSBAD EDDY NM
10.0 TERLINGUA BREWSTER TX
3.00 EUNICE LEA NM
1.00 TATUM LEA NM
4.00 LOVING LEA NM
4.00 JAL LEA NM
10.0 FORT DAVIS JEFF DAVIS TX
Other daily snowfall records were Abilene with one inch of snow, tying the record set in 1958; Dalhart. also with one inch of snow tying the record set in 1957; and a trace in Austin Camp Mabry, tying the record set in 1972. The official snowfall amount in El Paso was 2.9 inches. also a new record for the date. While El Paso has an average annual snowfall of only 6.6 inches, it has experienced some big snows. On December 13-14, 1987 a whopping 22.4 inches of snow fell, with 16.8 inches of that in a 24-hour period.
CoCoRaHS is a unique, non-profit, community-based network of volunteers of all ages and backgrounds working together to measure and map precipitation.
Friday, January 4, 2013
Wednesday, January 2, 2013
Snow Blankets More than Half of U.S.
As of today snow covers about 66 percent of the lower 48 states according to analyses from NOAA's National Operational Hydrologic Remote Sensing Center. A year ago approximately only 19 percent of the U.S. had snow cover. Snowfall has been plentiful in the Cascade and Sierra Nevada mountain ranges because of the Pacific storms that have rolled through the last few weeks. Winter snowpack is crucial to water supplies in the western U.S.
Thanks to the storms just prior to and after Christmas, snow cover extends from the Ozarks to south of the Ohio river. However, there is an area from Oklahoma, Missouri and through central and northern Illinois into southwestern Michigan that has little snow on the ground. The recent storms have followed a southerly track and there was a sharp cutoff on the northern end of the snowfall area with the storms.
Chicago has has only received 0.9 inch of snow so far this season. This is the fourth latest that Chicago has made it into the season without having even picked up an inch total of snowfall.In contrast, December 2012 was the seventh snowiest on record in Indianapolis with a total of 14.8 inches of snow. The Christmas Day storm dumped 17.5 inches on Perry, Arkansas, and 10.3 inches on Little Rock (9.0 inches on December 25, a new record for Christmas Day). As of this morning, though, there is no snow on the ground in Little Rock and only a trace in Perry.
Thanks to the storms just prior to and after Christmas, snow cover extends from the Ozarks to south of the Ohio river. However, there is an area from Oklahoma, Missouri and through central and northern Illinois into southwestern Michigan that has little snow on the ground. The recent storms have followed a southerly track and there was a sharp cutoff on the northern end of the snowfall area with the storms.
![]() |
| Snow depth reported by U.S. Cooperative weather stations for January 2, 2013. |
Thursday, December 20, 2012
A Cold, Stormy End to the Year?
![]() |
| Surface map at 6:00 p.m. CST December 20 |
The medium range models are still indicating a change in the upper level pattern in the next week to ten days along the lines of that shown in my December 17th post. The cold air is still bottled up in Alaska and northwest Canada. Fairbanks, for example, just experienced its sixth day in a row with lows -40F or lower and the warmest highs just reaching -19F. It appears that this cold air may be dislodged in the next week or so as an upper level ridge builds in the eastern Pacific and a trough develops across the U.S. Both the 6 to 10-day and 8 to 14-day outlooks issued today by the NWS Climate Prediction Center are indicating a higher probability for below normal temperatures across much of the country.
In addition, a series of low pressure systems moving across the U.S. in the next 10 days will likely produce precipitation in the Great Basin and/or the eastern half of the country.
Wednesday, December 19, 2012
Bizzard Warnings from Colorado to Wisconsin
![]() |
| Surface map for 10:00 am EST December 19, 2012 |
| NWS Watch/Warning map for 1:26 pm EST December 19 . Counties in orange are under a Blizzard Warning. |
Snowfall north and west of the storm center track will be heavy, with 9 to 12 inches or more of snow expected from southwestern Iowa into southwest Wisconsin. Model runs from this morning are indicating the as much as 18 inches of snow could fall in this band.
![]() |
| Probability of at least 12 inches of snow in the 24 hour period ending 6:00 am CST December 20 |
| Forecast snowfall totals by this morning's run of the GFS model. Image courtesy of Harris WeatherCaster. |
This is a dangerous storm, and everyone in the warned areas should take it very seriously. The combination of wind, snow, and low wind chill values will create life-threatening conditions for anyone caught outside. Even where snowfall amounts are expected to be only a few inches the winds will cause very hazardous travel conditions.
Be sure to check your local National Weather Service web site for the latest updates and information on this storm and its impacts on your area. The next round of forecast updates will be done mid to late afternoon.
Tuesday, December 18, 2012
Major Winter Storm on the Way
Residents from the Colorado Rockies to the Great Lakes are bracing for a major winter storm Wednesday and Thursday, while the Pacific Northwest gets a breather between storms today.
Yesterday the large upper trough along the Pacific coast produced more wind, rain and snow in the Pacific Northwest. Winds gusted to more than 80 miles per hour along the coast, and there were blizzard conditions in the mountains where snowfall in the Washington and Oregon Cascades totaled from one to three feet.
This large trough will continue to progress east tonight and tomorrow. By Wednesday morning a surface low associated with that trough will be organizing over Colorado. The surface low is expected to move to northern Oklahoma by Wednesday evening, to central Illinois by Thursday morning, and then to southwestern Michigan by Thursday evening. It will be rapidly intensifying during the day on Thursday and along with the snow will be high winds.
In the mountains of northwest Colorado up to 20 inches of snow is expected, and to the east significant snowfall is expected from Nebraska to the upper Great Lakes. Another system moving in from the Pacific will being more heavy snow to the Pacific Northwest.
As you might expect, a variety of winter advisories, watches, and warnings are in effect from the Rockies to the Great Lakes.
This is a great time for CoCoRaHs observers in the Plains and Midwest to review snow measurement procedures. Check out the snow measurement videos on CoCoRaHS YouTube channel, and/or the "In Depth" Snow Measurement training slide show on the CoCoRaHS web site.
Yesterday the large upper trough along the Pacific coast produced more wind, rain and snow in the Pacific Northwest. Winds gusted to more than 80 miles per hour along the coast, and there were blizzard conditions in the mountains where snowfall in the Washington and Oregon Cascades totaled from one to three feet.
| CoCoRaHs snowfall map for Washington for December 18, 2012 |
![]() |
| Forecast surface map for 7:00 EST December 19 |
In the mountains of northwest Colorado up to 20 inches of snow is expected, and to the east significant snowfall is expected from Nebraska to the upper Great Lakes. Another system moving in from the Pacific will being more heavy snow to the Pacific Northwest.
![]() |
| Probability of 4 or more inches of snow for the period from Wednesday evening to Thursday evening (left), and from Thursday evening to Friday evening (right). |
| Watch/warning map valid as of 4:45 pm EST December 18. Orange is a Blizzard Warning. Pink is a Winter Storm Warning. Blue area surrounding pink is a Winter Storm Watch. |
Monday, December 17, 2012
"It'll be a cold day in..."
![]() |
| Temperature map for 2:00 p.m. EST December 17, 2012 |
So far this winter the cold air has been bottled up in Alaska, the Yukon and the Northwest Territories of Canada, and the entire lower 48 has experienced very mild December weather.
The reason for this is that the upper level wind patterns have been generally zonal this month, that is, the winds have been flowing west to east without many undulations north or south. The map below is the average 500 millibar pattern (about 18,000 to 20,000 feet high) for the first 16 days of December. The winds flow along the lines on the map.
![]() |
| Mean 500 mb heights for December 1-16 |
Will the cold break loose, and when? The medium range models have been hinting at a change in the next 10 to 14 days. There are indicating a ridge developing in the eastern Pacific and deep trough to develop over central Canada and the central U.S. Should that occur, the dam will finally break and the cold air now parked over Alaska and the Arctic will come spilling south. Here's a forecast 500 millibar map for New Year's Eve that shows the type of pattern that could mean very cold weather for the central and northern U.S. Note the nearly north to south lines over and est of the Canadian Rockies indicating northerly winds.
This forecast map for New Year's Eve will change as we get closer to that date, so the usefulness of such a forecast now is that it hints at a change in the upper air pattern. It will be something to keep an eye over the next week or so. In the meantime, enjoy the mild December weather.
Wednesday, December 12, 2012
Fireballs in the Sky
| Location of the Geminid meteor shower. This image is from meteorshowersonline.com. |
This week there is another opportunity to view a meteor shower, the last "regular" meteor shower of the year. The Geminid meteor shower will occur from late night on December 13 until dawn on Friday, December 14. This shower often produces 50 or more meteors per hour, up to as much as 100 per hour. This year, a new moon means a dark sky on the peak night of the Geminid shower (mid-evening December 13 until dawn December 14). The peak usually occurs around 2:00 a.m. local time, but meteors should be visible beginning about 9:00 or 10:00 p.m. local time. The shower is named the Geminid because the radiant (the point where the meteors appear to originate) appears to come from the constellation Gemini. This will be visible in the northeast sky. If you have a smart phone, there is a neat free app called Google Sky Map which helps you find constellations or other astronomical features from your location.
While the new moon is favorable for viewing, the weather in much of the U.S. won't be ideal. A ridge of high pressure will be slipping off of the east coast late Wednesday, and the weather will be most favorable from the mid-Atlantic coast into the Gulf States and then to central Missouri. Clouds associated with a frontal system snaking its way from Quebec through the Central Plains to southern California will muck thing up for areas just south and to the north of the front. Low level moisture being pulled into Texas by the southerly winds on the back side of the ridge will likely result in cloudiness that hampers viewing there. A trough of low pressure heading out of the Front Range will keep skies cloudy in the Central Plains.
| Forecast surface map for Wednesday, December 13, 2012 at 6:00 p.m. CST. The area within the yellow line should have the most favorable viewing conditions for the Geminid meteor shower. |
Tuesday, December 11, 2012
December Tornadoes in the South
![]() |
| Surface map at 6:00 a.m. CST on December 10, 2021 |
On Monday afternoon rotating thunderstorms spun up two tornadoes in east-central Florida. An EF1 tornado touched down near Edgewater, and a waterspout was confirmed near Lake Apopka. More information on these storms can be found on the NWS Melbourne, FL web site.
| Northern Florida CoCoRaHS map for December 11, 2012 |
![]() |
| Surface map for 9:00 p.m. CST December 11, 2012 |
Sunday, December 9, 2012
Snow and Blizzard Conditions in Upper Midwest
![]() |
| Surface weather map at 12:00 p.m. CST today |
Snowfall amounts were heavy, with 12 to 17 inches of snow reported in a band across south-central Minnesota as of this evening, stretching from the South Dakota border to north of the Twin Cities. It is still snowing in some areas and final snowfall totals may be higher. Below is the snowfall map for the 48 hour period ending at 7:00 a.m. local time today
| This map is an objective analysis of NWS Cooperative Observer Program (COOP) and Community Collaborative Rain, Hail and Snow Network (CoCoRaHS) snowfall reports. The map is produced by the NWS. |
| 24 hour snowfall map for Brookings County, SD for December 9, 2012 |
Wednesday, November 28, 2012
Snow in the East, Another Stormy Period for the West
![]() |
| Surface map for 7:00 a.m. EST November 28. |
![]() |
| CoCoRaHS precipitation map for November 28. |
Another stormy period is ahead for the Pacific Northeast this rest of this week. CoCoRaHS observers will get another good workout for their rain gauges, with perhaps as much as 6 to 12 inches of rain expected in the next several days, especially in northern California and Oregon. Heavy snow is expected for the next several days in the higher elevations of the Shasta, central and northern Sierra Nevada, and Sawtooth mountain ranges.
![]() |
| Left: 5-day Quantitative Precipitation Forecast. Right: Probability of >8 inches of snow in 48 hours Forecasts issued by the NWS Meteorological Prediction Center. |
In the meantime, there will be significant warming across the central and eastern U.S. through the weekend. The snow currently on the ground in New Jersey will just be a memory by the weekend.
However, this could be the last period of mild weather for awhile for the eastern two thirds of the U.S. It appears that cold air will likely spread over the U.S. east of the Rockies by the middle of next week, and may be followed by several reinforcing pushes of cold air in the days to follow.
Tuesday, November 20, 2012
Storms Slam into Pacific Northwest
While most of the country has enjoyed tranquil weather for the last week or so (evidenced by the many gray dots on the CoCoRaHS national map), the Pacific Northwest has been pounded by a series of storms that have brought hurricane-force winds, torrential rain, and heavy snow. Flooding closed roads, winds toppled trees which in turn brought down high voltage power lines, heavy rain caused mudslides, and the avalanche danger was high from the heavy snow.
The first of these storms moved ashore from the Pacific on Saturday, followed by another on Monday.
The 7-day precipitation accumulation map shows accumulations ranging from five to more then ten inches all along the Oregon and Washington coasts. Most of that precipitation came with Monday's storm, which has been the most intense one so far.
CoCoRaHS observers in Oregon reported more than nine inches of rain.
A number of observers in Oregon noted that today's rainfall was the highest 24-hour amount they have ever recorded. The general nature of the rain and flooding apparent from this comment from the CoCoRaHS observer at Oakridge 4.6 NE in Lane County who measured 4.03 inches of rain:
Nope that's not a typo, we did get over 4" and almost all of that came after 5 PM. It rained off an on during the day but never heavily, less than a 1/2" before 5, and then it started really raining. We don't get flooding up here to speak of. Compared to other areas what we have right now is minor, but it is significant for us. I marked the flooding as minor because on an absolute scale that's what it is, but it is not typical for us. Last time I saw this sort of general standing water on our property was the heavy rains the winter of 05-06. We have had heavier flooding in the area, but from creeks overflowing, not just general standing water. The creeks are high right now, but not overflowing.
Washington also received heavy rain, and there were a number of new daily rainfall records, including daily rainfall records at the Seattle-Tacoma International Airport (2.13", old record 1.23" in 1962) and at the National Weather Service Office 2.60". old record 1.16" in 2003).
There were many wind gusts in excess of 70 mph reported yesterday with this storm. Here are a few of those gusts.
114 mph Naselle Ridge in the mountains of southwest Washington
106 mph Mt. Hebo nearTillamook, Oregon
101 mph Astoria bridge, Washington
101 mph Megler, Washington
98 mph Yaquina Head, Oregon
92 mph Astoria, OR
90 mph Garibaldi, Oregon
It appears the stormy weather will continue through the end of the week. A third storm will hit the Pacific Northwest Wednesday, and yet a fourth storm is forecast to arrive on Friday. Additional rainfall of one to three inches is expected from Washington south through northern California and a foot or more of new snow in the high Cascades and the northern Rockies by Wednesday night.
The first of these storms moved ashore from the Pacific on Saturday, followed by another on Monday.
![]() |
| Surface map for Saturday, November 17 (L) and for Monday, November 19 (R). |
| 7-day precipitation accumulations through 5:00 a.m. PST November 20 |
| CoCoRaHS map for Curry County in southwestern Oregon for November 20. |
Nope that's not a typo, we did get over 4" and almost all of that came after 5 PM. It rained off an on during the day but never heavily, less than a 1/2" before 5, and then it started really raining. We don't get flooding up here to speak of. Compared to other areas what we have right now is minor, but it is significant for us. I marked the flooding as minor because on an absolute scale that's what it is, but it is not typical for us. Last time I saw this sort of general standing water on our property was the heavy rains the winter of 05-06. We have had heavier flooding in the area, but from creeks overflowing, not just general standing water. The creeks are high right now, but not overflowing.
Washington also received heavy rain, and there were a number of new daily rainfall records, including daily rainfall records at the Seattle-Tacoma International Airport (2.13", old record 1.23" in 1962) and at the National Weather Service Office 2.60". old record 1.16" in 2003).
| CoCoRaHS map for King County, WA for November 20. |
114 mph Naselle Ridge in the mountains of southwest Washington
106 mph Mt. Hebo nearTillamook, Oregon
101 mph Astoria bridge, Washington
101 mph Megler, Washington
98 mph Yaquina Head, Oregon
92 mph Astoria, OR
90 mph Garibaldi, Oregon
It appears the stormy weather will continue through the end of the week. A third storm will hit the Pacific Northwest Wednesday, and yet a fourth storm is forecast to arrive on Friday. Additional rainfall of one to three inches is expected from Washington south through northern California and a foot or more of new snow in the high Cascades and the northern Rockies by Wednesday night.
![]() |
| Forecast surface map for the morning of Wednesday, November 21 |
Wednesday, November 14, 2012
November Snow
Winter weather has come early to the lower 48 states this year. First there was the heavy snow in the Appalachians associated with Sandy, and then heavy snow in New Jersey and southern New England with the nor'easter the following week. While attention has been focused on the east, snow has been falling with some regularity in the western U.S. In fact, snow cover across the northwestern quarter of the lower 48 states is above normal for this time of year.
There are a number of online resources for following snowfall across the U.S., and in fact across the northern hemisphere. The National Operational Hydrologic Remote Sensing Center website has an entire suite of products dedicated to monitoring snowfall, snow depth, and related measurements across the U.S. Here is the depiction of snow depth across the U.S. as of this morning. This map is based on modeled snow pack characteristics updated each day using all available ground, airborne and satellite observations. Note that the model analysis can be off in places. For example, the snow depicted in central and northwestern Illinois is overdone, and may be just a trace in a few spots.
The NOAA U.S. National Ice Center also monitors ice and snow cover across North America and the Northern Hemisphere. This analysis shows only where snow is on the ground, and does not show snow depth.
For a view of the Northern Hemisphere in somewhat more detail, the Rutgers University Global Snow Lab provides a suite of charts and graphs that monitors snow cover. A nice feature of the Global Snow Lab are the snow climatology maps and the departure maps, which show where snow cover is above or below normal as of a certain date. Note that like the National Ice Center maps, these maps depict the extent of snow cover and do not provide any information on snow depth.
Of course, last but not least are CoCoRaHS maps. The national map from Tuesday morning clearly shows snow on the ground in the west as well as the upper Midwest and northeast..
The greatest snow depths on the CoCoRaHS maps were found just east of Salt Lake City, where 7 to 13 inches of snow covered the ground as of Tuesday morning.
Snowfall and snow depth measurements from CoCoRaHS observers are needed and used by variety of people monitoring snow across the country from the National Weather Service to municipalities to snow removal services. Now is the time to review and refresh yourself on snow measurement procedures. The snow measurement training program is available on the CoCoRaHS web site, and the Snow Measurement webinar video is available on YouTube.
There are a number of online resources for following snowfall across the U.S., and in fact across the northern hemisphere. The National Operational Hydrologic Remote Sensing Center website has an entire suite of products dedicated to monitoring snowfall, snow depth, and related measurements across the U.S. Here is the depiction of snow depth across the U.S. as of this morning. This map is based on modeled snow pack characteristics updated each day using all available ground, airborne and satellite observations. Note that the model analysis can be off in places. For example, the snow depicted in central and northwestern Illinois is overdone, and may be just a trace in a few spots.
The NOAA U.S. National Ice Center also monitors ice and snow cover across North America and the Northern Hemisphere. This analysis shows only where snow is on the ground, and does not show snow depth.
For a view of the Northern Hemisphere in somewhat more detail, the Rutgers University Global Snow Lab provides a suite of charts and graphs that monitors snow cover. A nice feature of the Global Snow Lab are the snow climatology maps and the departure maps, which show where snow cover is above or below normal as of a certain date. Note that like the National Ice Center maps, these maps depict the extent of snow cover and do not provide any information on snow depth.
![]() |
| Maps from the Rutgers University Global Snow Lab for November 13, 2012 |
Of course, last but not least are CoCoRaHS maps. The national map from Tuesday morning clearly shows snow on the ground in the west as well as the upper Midwest and northeast..
The greatest snow depths on the CoCoRaHS maps were found just east of Salt Lake City, where 7 to 13 inches of snow covered the ground as of Tuesday morning.
Snowfall and snow depth measurements from CoCoRaHS observers are needed and used by variety of people monitoring snow across the country from the National Weather Service to municipalities to snow removal services. Now is the time to review and refresh yourself on snow measurement procedures. The snow measurement training program is available on the CoCoRaHS web site, and the Snow Measurement webinar video is available on YouTube.
Saturday, November 10, 2012
"When the gales of November came slashin'... "
Today is the 37th anniversary of the sinking of the Great Lakes freighter the Edmund Fitzgerald. The first time I really became aware of this incident was when I first heard Gordon Lightfoot's haunting ballad "The Wreck of the Edmund Fitzgerald". The Great Lakes have a long history of intense fall and winter storms and the wrecks of hundreds of ships litter the lake bottoms. The weather during the fall can quickly go from good to very bad, and such was the case in November of 1975.![]() |
| Surface map on November 6, 1975 |
In Superior, Wisconsin the Edmund Fitzgerald was loaded with more than 26,000 tons of taconite pellets destined for a steel mill near Detroit. The weather while the Fitzgerald was in Superior was, well, superior. Temperatures early in the week reached 74°F, and when the Fitzgerald left port at 4:30 p.m. on November 9 the temperature was in the 50s°F and skies were cloudy. She soon joined up with the Arthur M. Anderson, another freighter which left Two Harbors, Minnesota bound for Gary, Indiana.
![]() |
| Surface map for the morning of November 9, 1975 |
At 7:00 p.m. the National Weather Service issued gale warnings for Lake Superior, forecasting E to NE winds during the night, shifting to NW to N by the afternoon of November 10. At approximately 10:40 p.m. the NWS revised its forecast for eastern Lake Superior to easterly winds becoming southeasterly the morning of the 10th. At about 2:00 am November 10 the NWS upgraded the gale warning to a storm warning with a prediction of "northeast winds 35 to 50 knots becoming northwesterly 28 to 38 knots on Monday, waves 8 to 15 feet". The captains of the two freighters decided to take a route closer to the Canadian shore which would protect them from the northeast winds.
![]() |
| The surface weather map for the morning of November 10, 1975, about 12 hours before the Edmund Fitzgerald sank. |
The northwest winds were the worst possible situation for the Fitzgerald. The winds had a large fetch over open water allowing large waves to build. The Fitzgerald by this time was sailing southeast toward Whitefish Bay and passed over dangerous shallow water near Six Fathom Island.
At 3:30 p.m. on November 10 the captain of the Fitzgerald radioed the Anderson and reported that the ship was taking on water and listing. The Fitzgerald had also lost its radar, and was now relying on the Anderson to be its "eyes" in the storm. The first mate of the Anderson contacted the Fitzgerald at 7:10 p.m. and Caption McSorley of the Fitzgerald, when asked how they were doing, said "We are holding our own." At 7:15 p.m. the Edmund Fitzgerald disappeared from the radar.
On November 14 a Navy aircraft detected a large magnetic anomaly about 17 miles from Whitefish Point. A Coast Guard cutter located two large pieces of wreckage three days later using side scan sonar. In May 1976 a Navy controlled underwater recovery vehicle confirmed the wreckage was that of the Edmund Fitzgerald.
There are a number of theories on how the Fitzgerald sank. The initial theory was that the ship took on water through poorly sealed hatches, lost buoyancy, and sank when hit by huge waves. Another theory is that the ship may have been damaged in shallow water when it passed near Six Fathom Shoal. The debate continues to this day.
If you would like to read more about the Edmund Fitzgerald, check the following sources.
The Fateful Journey (The Great Lakes Shipwreck Museum)
NTSB Marine Accident Report: SS EDMUND FITZGERALD Sinking in Lake Superior
Wednesday, November 7, 2012
A Winter Question for You
We are a little more than a week into November and there have already been many signs of winter in the U.S. Although the winter solstice is still six weeks away (December 21st at 5:12 a.m. CST), meteorologists and many of us have our own "definition" of when winter starts. It's something I've personally been interested in for some time, and now I am working on a project that requires us to "define" winter. Your answers might help us shape some of this research
This question is open to all - those in warmer climates where winter is the season that isn't spring and summer, and those colder climates where winters can be brutal at times.
So, what defines the start of winter for you?
Post your responses here (preferred), or you can email me at hberg74@gmail.com.It would be very helpful if you would tell us what state you are from. After a period of time I will compile the results and present them in a future blog post along with a scientific perspective on the seasons. I think the results will be very interesting.
I look forward to hearing from you!
This question is open to all - those in warmer climates where winter is the season that isn't spring and summer, and those colder climates where winters can be brutal at times.
So, what defines the start of winter for you?
Post your responses here (preferred), or you can email me at hberg74@gmail.com.It would be very helpful if you would tell us what state you are from. After a period of time I will compile the results and present them in a future blog post along with a scientific perspective on the seasons. I think the results will be very interesting.
I look forward to hearing from you!
Tuesday, November 6, 2012
The Numbers on Sandy
From a meteorological standpoint Sandy was an impressive and historic storm. Here are some of the more interesting statistics for this historic storm.
Near-record central pressure of 940 millibars (27.76 inches) when the center of the storm was about 35 miles off the New Jersey coast. This was the lowest pressure of any storm that has made landfall north of Cape Hatteras, NC. Hurricane Gladys in 1977 holds the record the for lowest pressure of 938 millibars (27.73 inches), a category 4 hurricane which never made landfall in the U.S. At landfall Sandy's central pressure was 946 millibars. A number of locations set reord lower pressure readings. Atlantic City, NJ dropped to 948.3 millibars, breaking the old record of 961 millibars on March 6, 1932.
Winds gusted to in excess of 50 mph from Maine south through Virginia, but the strongest winds occurred from Washington DC north through New York City. Here are some of the locations that recorded hurricane force winds:
96 mph Eaton’s Park,NY
90 mph Islip, NY
90 mph Chesapeake Bay Bridge, MD
89 mph Surf City, NJ
88 mph Montclair, NJ
88 mph Tuckerton, NJ
87 mph Newport, NJ
86 mph Westerly, RI
85 mph Madison, CT
83 mph Cuttyhunk, MA
81 mph Allentown, PA
79 mph JFK International Airport, NY
79 mph Thomas Point, MD
79 mph Chester Gap, VA
76 mph Laytonsville, MD
78 mph Newark Int’l Airport, NJ
74 mph LaGuardia Airport, NY
STORM SURGE
The combination of the hurricane-force onshore winds, the timing of high tide near Sandy's landfall, a full moon, and coastal topography resulted in destructive storm surge from Virginia to Rhode Island. The storm surge along the Virginia coast was 4 to 6 feet. Of course, as we know the worst surge was near and just north of Sandy's center in New Jersey and New York.
Here are the most impressive and significant storm surges, measured as feet above normal average low tide:
RAINFALL from 10/28 to 11/1
There were more than 320 daily precipitation records set October 29-31 as a result of Sandy. You can find record values at the National Climatic Data Center web site U.S. Records page.
New Jersey
An impressive 237 New Jersey CoCoRaHS observers reported rainfall during this five-day period. The highest amount report was 12.71 inches at Stone Harbor 1.6 NNW in Cape May County, with 9.73 inches of that total on October 30. Other CoCoRaHS observers in Cape May County had 11.91 inches (Wildwood Crest 0.6 NNE); 11.70 inches (Wildwood Crest 0.1 WSW); and 11.41 inches (Middle Twp 4.4 SW). Other totals from Cape May County were generally greater than 7 inches.
Virginia
CoCoRaHS observers reported period totals ranging from five to ten inches in eastern Virginia. The highest amount reported was 9.83 inches at Cashville .01 S in Accomack County, VA. This total is likely higher, as there were no reports after the morning of October 30. The heaviest amounts in Virginia were in a corridor from Newport News and Virginia Beach northward and generally ranged from six to nine inches.
Maryland
Amounts reported by CoCoRaHS observers in Maryland ranged from five to almost 11 inches. Here are the amounts greater than ten inches:
10.85 Easton 2.4 SE Talbot County
10.70 Greensboro 1.4 ENE Caroline County
10.68 Ridgely 0.2 ESE Caroline County
10.29 Queenstown 2.6 S Queen Anne's County
10.22 Easton 1.2 SSW Talbot County
District of Columbia
The CoCoRaHS observer at Washington 5.1 NW (DC) reported 6.03 inches of rain.
Delaware
Rainfall in Delaware ranged from five to ten inches. The highest CoCoRaHS amount reported there was 9.88 inches at Dover 6.4 WNW (Kent County). There were a number of stations reporting over seven and eight inches.
Pennsylvania
Eastern Pennsylvania also received heavy rain from this system with amounts ranging from three to eight inches. The observer at French Creek 3.4 SE (Chester County) measured 8.19 inches of rain during the period, and the observer at Schellsburg 2.6 WNW (Bedford County) reported 7.94 inches.
The heaviest precipitation amounts in West Virginia were in the higher elevations that also received snow and ranged from four to more than six inches. The highest precipitation amount for the period was 6.84 inches, along with 9.0 inches of snow at French Creek 3.4 SE in Upshur County.
New York, Connecticut, and north
One to four inches of rain were reported in New York, two inches in Connecticut, one to three inches in Rhode Island, one half to 4.5 inches in Massachusetts, one half to 2.5 inches in Vermont, generally one to five inches in New Hampshire, but with 8.45 inches at Gorham 3.1 S and 6.23 inches at Randolph 1.4 NE, both in Coos County. One half to 3.5 inches of rain fell across Maine.
Ohio
The rain from Sandy extended as far west as Ohio and Indiana. Four to more than seven inches of rain fell in eastern Ohio, with the heaviest and lake-enhanced amounts in Lake, Cuyahoga, and Lorain Counties which border the southern shore of Lake Erie. More than six inches of rain were measured in these counties, with 7.68 inches at Painesville 3.8 SSW in Lake County and 7.54 inches by the observer at Mayfield 0.2 NW in Cuyahoga County.
SNOW
Snow fell in southwestern Pennsylvania, much of West Virginia, western Maryland, western and southwest Virginia, southeastern Ohio, western North Caorina, and eastern Tennessee. The heavy, wet snow brought down trees and power lines. Some of the highest snowfall totals were:
Richwood, WV 36"
Mount LeConte, TN: 34"
Snowshoe, WV 32"
Quinwood, WV 29"
Frostburg, MD 28"
Of course, the book hasn't closed on Sandy. At its peak 8.5 million customers in the eastern U.S. were without power. As of tonight there are still 1 million without power, and the impending storm tomorrow will likely slow the restoration of power and may cause additional outages.
Sadly, Sandy has been responsible for 170 deaths with 111 of those in the U.S., 2 in Canada, and 57 Carribean.
Near-record central pressure of 940 millibars (27.76 inches) when the center of the storm was about 35 miles off the New Jersey coast. This was the lowest pressure of any storm that has made landfall north of Cape Hatteras, NC. Hurricane Gladys in 1977 holds the record the for lowest pressure of 938 millibars (27.73 inches), a category 4 hurricane which never made landfall in the U.S. At landfall Sandy's central pressure was 946 millibars. A number of locations set reord lower pressure readings. Atlantic City, NJ dropped to 948.3 millibars, breaking the old record of 961 millibars on March 6, 1932.
Winds gusted to in excess of 50 mph from Maine south through Virginia, but the strongest winds occurred from Washington DC north through New York City. Here are some of the locations that recorded hurricane force winds:
96 mph Eaton’s Park,NY
90 mph Islip, NY
90 mph Chesapeake Bay Bridge, MD
89 mph Surf City, NJ
88 mph Montclair, NJ
88 mph Tuckerton, NJ
87 mph Newport, NJ
86 mph Westerly, RI
85 mph Madison, CT
83 mph Cuttyhunk, MA
81 mph Allentown, PA
79 mph JFK International Airport, NY
79 mph Thomas Point, MD
79 mph Chester Gap, VA
76 mph Laytonsville, MD
78 mph Newark Int’l Airport, NJ
74 mph LaGuardia Airport, NY
STORM SURGE
The combination of the hurricane-force onshore winds, the timing of high tide near Sandy's landfall, a full moon, and coastal topography resulted in destructive storm surge from Virginia to Rhode Island. The storm surge along the Virginia coast was 4 to 6 feet. Of course, as we know the worst surge was near and just north of Sandy's center in New Jersey and New York.
Here are the most impressive and significant storm surges, measured as feet above normal average low tide:
- 14.38 ft at Kings Point, NY
- 13.88 ft at The Battery, Lower Manhattan. This broke the old record of 10.02 feet reached during Hurricane Donna in 1960.
- 13.31 ft at Sandy Hook, NJ
RAINFALL from 10/28 to 11/1
There were more than 320 daily precipitation records set October 29-31 as a result of Sandy. You can find record values at the National Climatic Data Center web site U.S. Records page.
New Jersey
An impressive 237 New Jersey CoCoRaHS observers reported rainfall during this five-day period. The highest amount report was 12.71 inches at Stone Harbor 1.6 NNW in Cape May County, with 9.73 inches of that total on October 30. Other CoCoRaHS observers in Cape May County had 11.91 inches (Wildwood Crest 0.6 NNE); 11.70 inches (Wildwood Crest 0.1 WSW); and 11.41 inches (Middle Twp 4.4 SW). Other totals from Cape May County were generally greater than 7 inches.
Virginia
CoCoRaHS observers reported period totals ranging from five to ten inches in eastern Virginia. The highest amount reported was 9.83 inches at Cashville .01 S in Accomack County, VA. This total is likely higher, as there were no reports after the morning of October 30. The heaviest amounts in Virginia were in a corridor from Newport News and Virginia Beach northward and generally ranged from six to nine inches.
Maryland
Amounts reported by CoCoRaHS observers in Maryland ranged from five to almost 11 inches. Here are the amounts greater than ten inches:
10.85 Easton 2.4 SE Talbot County
10.70 Greensboro 1.4 ENE Caroline County
10.68 Ridgely 0.2 ESE Caroline County
10.29 Queenstown 2.6 S Queen Anne's County
10.22 Easton 1.2 SSW Talbot County
District of Columbia
The CoCoRaHS observer at Washington 5.1 NW (DC) reported 6.03 inches of rain.
Delaware
Rainfall in Delaware ranged from five to ten inches. The highest CoCoRaHS amount reported there was 9.88 inches at Dover 6.4 WNW (Kent County). There were a number of stations reporting over seven and eight inches.
Pennsylvania
Eastern Pennsylvania also received heavy rain from this system with amounts ranging from three to eight inches. The observer at French Creek 3.4 SE (Chester County) measured 8.19 inches of rain during the period, and the observer at Schellsburg 2.6 WNW (Bedford County) reported 7.94 inches.
The heaviest precipitation amounts in West Virginia were in the higher elevations that also received snow and ranged from four to more than six inches. The highest precipitation amount for the period was 6.84 inches, along with 9.0 inches of snow at French Creek 3.4 SE in Upshur County.
New York, Connecticut, and north
One to four inches of rain were reported in New York, two inches in Connecticut, one to three inches in Rhode Island, one half to 4.5 inches in Massachusetts, one half to 2.5 inches in Vermont, generally one to five inches in New Hampshire, but with 8.45 inches at Gorham 3.1 S and 6.23 inches at Randolph 1.4 NE, both in Coos County. One half to 3.5 inches of rain fell across Maine.
Ohio
The rain from Sandy extended as far west as Ohio and Indiana. Four to more than seven inches of rain fell in eastern Ohio, with the heaviest and lake-enhanced amounts in Lake, Cuyahoga, and Lorain Counties which border the southern shore of Lake Erie. More than six inches of rain were measured in these counties, with 7.68 inches at Painesville 3.8 SSW in Lake County and 7.54 inches by the observer at Mayfield 0.2 NW in Cuyahoga County.
SNOW
![]() |
| 72-hour snowfall ending October 31, 2012 |
Richwood, WV 36"
Mount LeConte, TN: 34"
Snowshoe, WV 32"
Quinwood, WV 29"
Frostburg, MD 28"
Of course, the book hasn't closed on Sandy. At its peak 8.5 million customers in the eastern U.S. were without power. As of tonight there are still 1 million without power, and the impending storm tomorrow will likely slow the restoration of power and may cause additional outages.
Sadly, Sandy has been responsible for 170 deaths with 111 of those in the U.S., 2 in Canada, and 57 Carribean.
Subscribe to:
Posts (Atom)