Tuesday, March 29, 2022

Mountain Rain and Snow: Citizen Science - A WxTalk Recap

Mountain Rain and Snow is a citizen science project coordinated by Lynker Tech, the Desert Research Institute, and the University of Nevada, Reno to document winter precipitation in the mountains. Of particular interest are situations where snow is falling with surface temperatures above freezing.

Meghan Collins, Education Program Manager at the Desert Research Institute and co-investigator for the project, described this project in her WxTalk webinar on March 10th. Answering the simple question “Is it raining, snowing, or mixed precipitation right now?" can make a big difference for estimating just how much precipitation falls in winter. Mountain Rain and Snow engages citizen scientists like CoCoRaHs observers and others to help collect data to answer this question.

Scientists use temperature thresholds to determine where and when a storm will transition from rain to snow. If that threshold is off, it can affect predictions of flooding, snow accumulation, and avalanche hazard. This rain-snow temperature threshold is primarily a function of humidity and elevation. Ground-based observations of the precipitation phase provide the information that can be correlated with temperature and relative humidity observations.


This project should be right up the alley of CoCoRaHS observers in mountainous areas.The webinar describes how to sign up to be a participant, and the instructions are also included in the webinar description on the CoCoRaHS web site.

You can view the webinar at Mountain Rain and Snow.


Past webinars can be viewed in the WxTalk Webinar Series archive which includes descriptions and links to all of the webinars presented since 2011.

 WX is a common abbreviation for "weather". It originated as the Morse code shorthand for the word "weather".

Wednesday, February 23, 2022

Meterological Memories - A WxTalk Recap

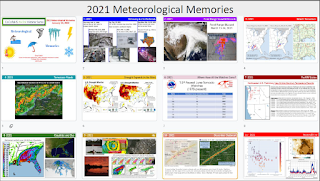
A review of some of the more significant hazardous weather events that affected life and property in 2021 kicked off the CoCoRaHS 2022 WxTalk Webinar Series in January. The webinar was presented by Greg Carbin, Chief of Forecast Operations for the National Weather Service Weather Prediction Center in College Park, Maryland.

Events ranging from the deadly Texas Arctic outbreak in February to the March tornado outbreak in the south, to the scorching heat in the Pacific Northwest during the summer were described with photos, maps, and loops of satellite and radar data. Among the other events covered were the impacts from the tropical storm season and the devastating Marshall Fire west of Denver in November.

The entire webinar can be viewed at this link: 2021 Meteorological Memories


You can view past webinars in the WxTalk Webinar Series archive which includes descriptions and links to all of the webinars presented since 2011.

 WX is a common abbreviation for "weather". It originated as the Morse code shorthand for the word "weather".

Tuesday, January 12, 2021

Happy New Climate Decade, CoCoRaHS!


Average annual precipitation (inches) from 1991 to 2020. Source: GRIDMET.

A New Normal for Weather and Climate: New Decade? Didn't that start last year? Yes, but every ten years the climate world updates our “climate normals.” A "climate normal" is an average using the most recent three decades as a frame of reference. They are updated on years ending in "1" rather than "0." The climate normals we have grown accustom to were for 1981-2010, but this year we’ll kick out the 1980’s and officially usher in the 2010’s. You’ve probably heard the phase “new normal” a lot recently. In weather and climate, we quite literally have new normals.

In honor of the new decade, and all your efforts, I thought we could take a look at how our normals changed in the last decade. The official National Centers for Environmental Information Normals won't be out until later this year. In the meantime, we can get a preview using a dataset called GRIDMET. As is the case with a number of spatial representations of weather data, CoCoRaHS data were used to help create this product. The map shown above is GRIDMET's best estimate of our new precipitation normals across the Continental US. Again, this is using 1991-2020 data. 

You may have heard Nolan mention that CoCoRaHS stations with a long enough record will be included in the computation of the new official normals. This is a big deal. The observations used to compute normals are the backbone of our understanding of climate across the US. More and more is being done with satellites and computer models, and while we fully embrace these advances, they’re not possible without great validation from ground-truth, or surface weather observations. That’s you! One million times over, thank you for all you do.

How have things changed? 

While wet and dry climate extremes tend to balance each other out over time, updating our climate normals can come with significant changes. Not all decades look alike. Sometimes the changes you see in normals are most influenced by what you’ve experienced recently. For instance, the Ohio River Valley has been wetter in the last 10 years than any previous decade on record. In others, it may be more about the data you’re leaving behind. In my home state of Colorado, we are ousting the 80’s, in which we had six consecutive years of precipitation above our long-term average. 

The US as a whole experienced a wet decade. The last eight consecutive years were wetter than our country’s long-term average. 2019 was a record year with a Contiguous US (CONUS) average of 34.82” of precipitation. 1991-2020 climate normals east of the Mississippi River will be almost exclusively wetter than 1981-2010 normals.  

Change in average annual precipitation (inches): 1991-2020 - 1981-2010. Source: GRIDMET.

However, one might argue the rich got richer and the poor got poorer. For example, the desert southwest, which is already the most arid part of CONUS, became even drier. This pattern is hinted at by computer models that show us the implications of a warming climate. A warmer atmosphere can hold more moisture, which can create bigger storms. However, arid zones, like the southwest, may expand as air circulation patterns change.

We also know there are many factors creating natural variations in climate, like the El Niño Southern Oscillation. Typically, the Pacific Northwest is wetter than normal during La Niña years and drier than normal during El Niño years. Conversely, California receives more significant rain events during El Niño. The changes to our normals would seem to suggest that the last 10 years were La Niña-dominant. They were. Not only did we see more La Niña than El Niño the last 10 years, we actually experienced the reverse in the 1980s. 

All things considered, we know each 10 year period is going to give us something new. But when we consider differences in the climate system between the 1980s and 2010s, we can make some sense of the patterns we're seeing.

Take care,

Peter Goble

CoCoRaHS Headquarters


Tuesday, October 13, 2020

Can You Be Considered for a State Record? Siting and Observer Practices are Important!

The following is a Twitter thread posted by the National Centers for Environmental Information- Climate (@NOAANCEIClimate). It reviews the verification of state record precipitation for Virginia in 2018 by the State Climate Extremes Committee (SCEC), and a CoCoRaHS station was in the mix. CoCoRaHS measurements can be considered for records, and are subject to the same review as Cooperative stations in this regard. The Twitter thread starts below the cut. Links to the reports about the record are at the end of the thread.

=====================================================================

October 13, 2020

In 2018, buckets of rain fell on Virginia. Not just one but several weather stations reported annual precipitation that exceeded the state record. Which would take the prize? Only NCEI’s State Climate Extremes Committee could decide. And it got complicated!

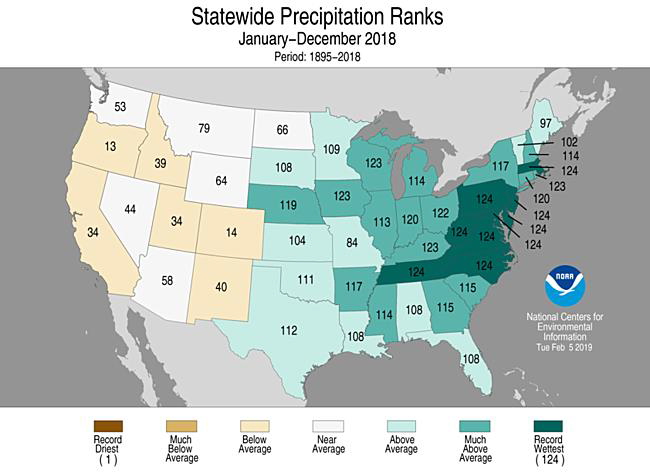
In October 2018, the remnants of Hurricane Michael soaked Virginia. Michael followed Florence (September) and Alberto (May), and these storms arrived amid a persistent wet weather pattern in the East. Nine states from TN to MA recorded their wettest year on record in 2018. 

Image

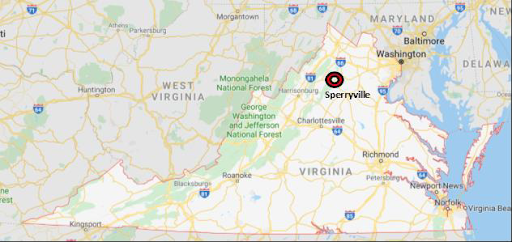
Three stations reported annual precip totals that bested Virginia’s previous (unofficial) record of 86.06", set in 1996: 1) Montebello, 2) Cave Spring, near Roanoke, and 3) Sperryville. Only one would emerge on top. The SCEC was convened to test the claims.

Image 

First contender: Montebello! Claimed precipitation total: 104”. But SCEC found some measurements were wrong, knocking the total down to 89.90”. Other problems: missed observations and failure to record liquid-equivalent measurements for snow.  

Image 


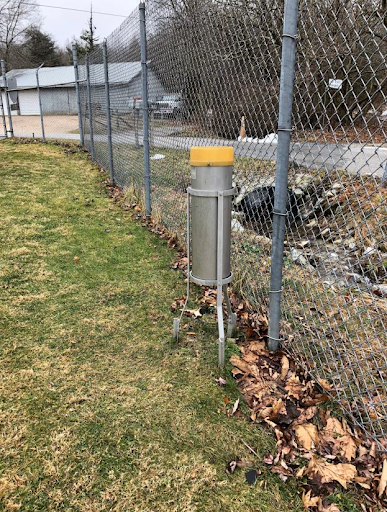
Here’s the kicker: Montebello’s gauge was too close to a fence, and thus might have collected extra drips, calling into question the accuracy of all station measurements. SCEC verdict: Rejected!

Image

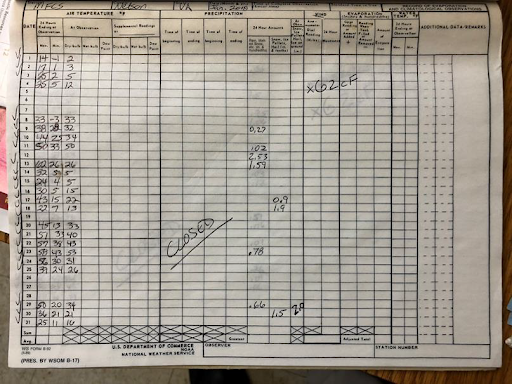
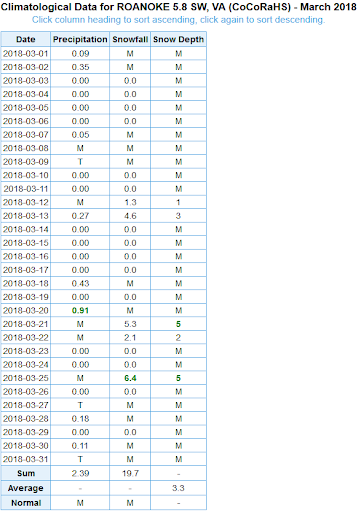
Next contender: Cave Spring, near Roanoke! Claimed precipitation total: 87.33”. Once again, there were problems: snow-water equivalents were not recorded for several days. (The ‘M’ in the table means ‘missing.’) 

Image 

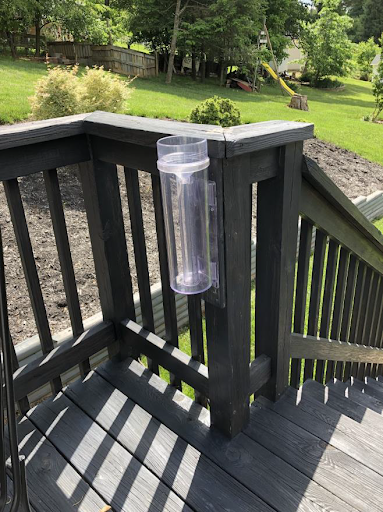
Even worse: the station had its gauge mounted level with a deck rail, making it “highly likely that raindrops hitting the deck railing would enter the gauge,” thus undermining all measurements. SCEC verdict: Rejected!  

Image 


Next contender: Sperryville! Claimed precipitation total: 94.43”. This station was operated by a music teacher who had been observing for more than two decades. A staffer from the NWS Baltimore-Washington visited the site and found that “his paper forms are extremely meticulous.”

Image


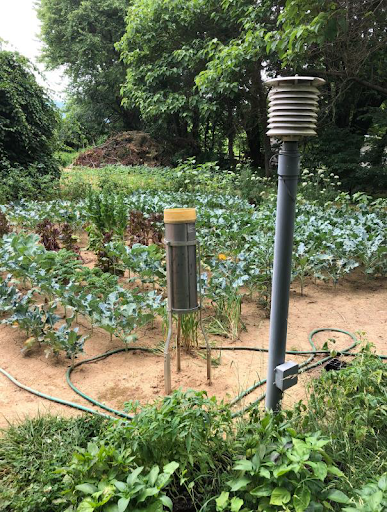
The gauge was well positioned, without a fence in sight (bonus: it was in a beautiful vegetable garden!). SCEC verdict: Approved, unanimously! The Sperryville annual precipitation total of 94.43” became the official record for Virginia.

Image 

The moral of this SCEC story: Record observations daily, don’t forget snow-water equivalents, and keep your rain gauge away from fences and railings! Read the SCEC reports on Virginia: bit.ly/2ZZWF9V, bit.ly/3mLlyQr.

 
And don't forget to read our story on the SCEC! bit.ly/32SvCPJ